

USD/JPY to clear direction at the key resistance level
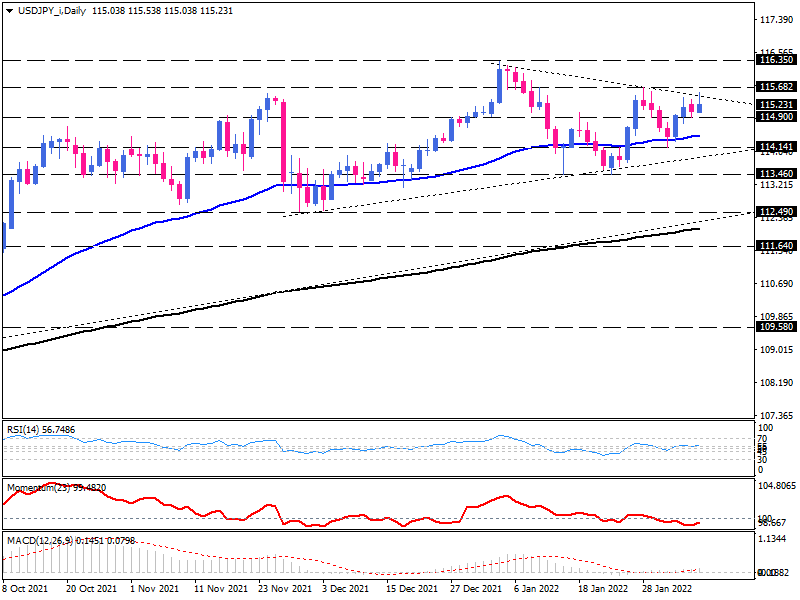
As we can see on the daily chart, the pair has been trading upward since early 2020, moving above both the 50 and 200-day exponential moving averages for a long time. But recent price action shows it has stuck in a triangle pattern after reaching a multi-year top at 116.340. currently, the price is testing the dynamic resistance of the triangle upper edge.
An upside breakout can possibly lead the market towards the previous top at 115.68. If bulls overstep this hurdle, a stronger dollar will put buyers on their toes to reconquer the multi-year highs around 116.35.
However, these consecutive upper shadows can be taken as a sign that resistance may hold. If that's the case, sellers can take a cue from this pattern and drag the USD down towards the 114.90 barrier. Further decline may result in hitting the 50-day EMA and the previous area of interest around 114.14, which aligns with the triangle bottom.
Short-term view
On the four-hour chart, we have this current bearish candlestick, indicating a pause in upside movement.
Suppose buyers keep the ground above the 115.42 handle. In that case, the immediate resistance will encounter from the boundary of 115.68 - 115.74 in the smack with the 161.8% Fibonacci level. Further traction will send the price towards 115.94 before reaching the crucial resistance area between the 261.8% Fibonacci level and the 116.350 mark.
On the downside, if the current session closes below the low of this emerging short-term reversal pattern at 115.31, the pair may back down to touch the 50-EMA in line with 114.91. Should sellers keep moving below this level, they may turn the play bearish. If that happens, the price can keep falling towards 200 EMA.
Momentum oscillators indicate buyers have the upper hand, but they are also conveying that the upside forces are losing steam. The RSI is moving lower in the buying territory, momentum is trending upward above the 100-baseline, and MACD bars are flattening but still holding above the signal line in a positive area.
Technical Analysis
Discover ideal profit opportunities for your everyday trading with the help of our in-depth technical insights comprised of facts, charts and trends.


