

USD/JPY approaches support as bullish momentum fades
As the US dollar took a breather on Friday after expectations for full percentage rate hikes receded, the USD/JPY is experiencing some profit taking on Friday. The pair consolidates the biggest daily gains in a month around the highest level since September 1998.
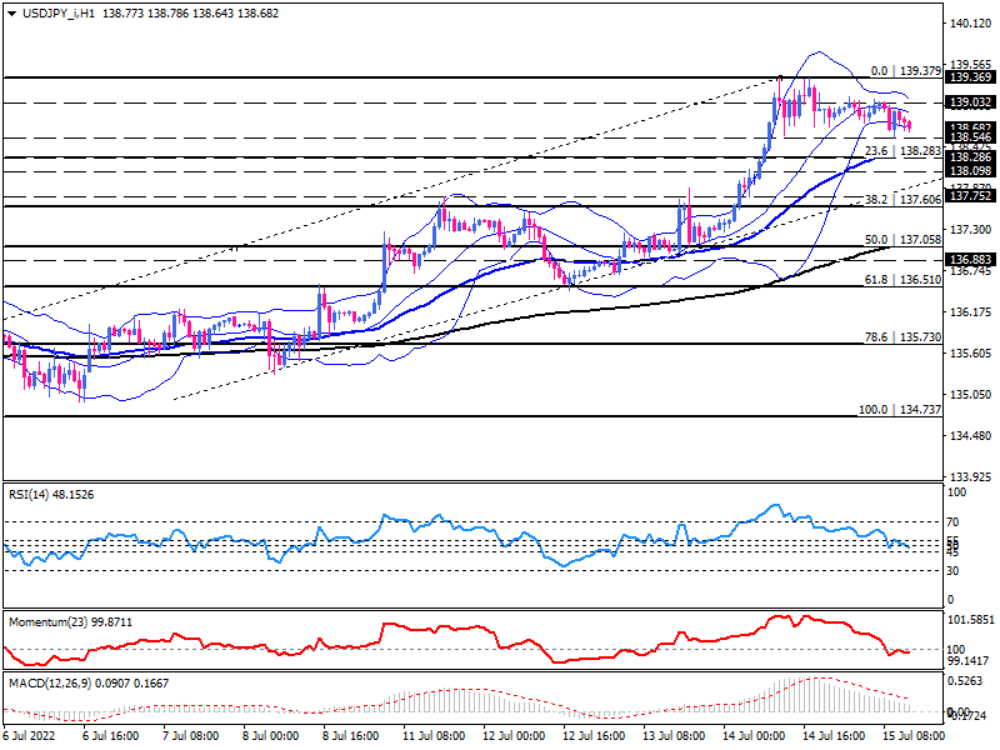
As seen on the one-hour chart, the recent rally has been interrupted by consolidation between 139.032 and 138.546, which came after 139.369 reached a top. USD/JPY, however, is currently regarded as being in an uptrend, as the price is forming major tops and bottoms, and the 50-EMA is still holding as a support level, but we may be in for another test of the ascending trendline at some point in the future.
As the price descends towards the 138.546 – 138.283 area between the boundary of the 50-EMA and 23.6% Fibonacci retracement, making its significance even more prominent, the narrowing Bollinger bands indicate a squeeze. The squeeze is an indication of the beginning of a new market movement.
If the pair pulls back from this support area, more buyers may join the uptrend, pushing the pair towards 139.032, the squeeze resistance. Further upward momentum could lift the USD/JPY above this hurdle and shift the bulls' attention to the previous level of interest at 139.369.
Otherwise, should the 50-EMA fail to hold, a break below the 23.6% Fibonacci retracement can send the prices down towards 138.098 to meet the ascending trendline.
Short-term momentum oscillators suggest that bullish momentum is fading. RSI has decreased from buying to neutral zone due to buyers retreating. Momentum has fallen below the 100-threshold, and MACD bars are shrinking below the signal line.
Technical Analysis
Discover ideal profit opportunities for your everyday trading with the help of our in-depth technical insights comprised of facts, charts and trends.


