

USD/CHF sellers initiate an intraday reversal
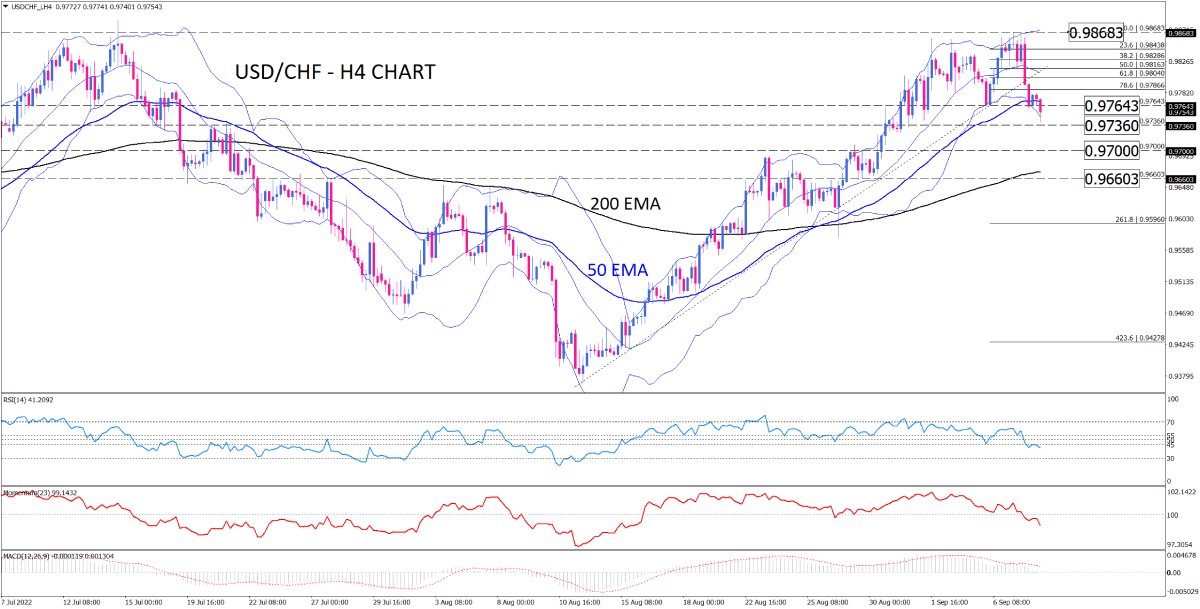
As seen on the four-hour chart, USD/CHF has been in an uptrend since mid-August, with buyers saving the market from its almost four-month low. However, the pair fell into the sideline in the 50-EMA zone after 0.98683 capped the rally at its one-month high. Selling pressure has punched the 50-EMA support line, which is in line with the last swing bottom at 0.97643. If selling forces get enough momentum, the pair can break this confluence of support, which will result in forming a double-top reversal pattern.
Closing below the 0.97643 can put the USD/CHF on the back foot towards the 0.97360 barrier. Suppose this latter can’t provide sufficient support to the price. In that case, the decline may continue for retesting the previous level of interest at 0.9700 before the 200-EMA gets under threat, putting 0.96603 into the spotlight.
Alternatively, if the lower Bollinger band acts as a support, buyers may reverse the move in the short term, aiming for the middle band around 0.98040.
Short-term momentum oscillators are in favour of bears. The widening bands imply accelerating bearish momentum with the price at the lower Bollinger band. Likewise, RSI points down in the selling region, and momentum is also drowning below the 100-threshold.
Technical Analysis
Discover ideal profit opportunities for your everyday trading with the help of our in-depth technical insights comprised of facts, charts and trends.


