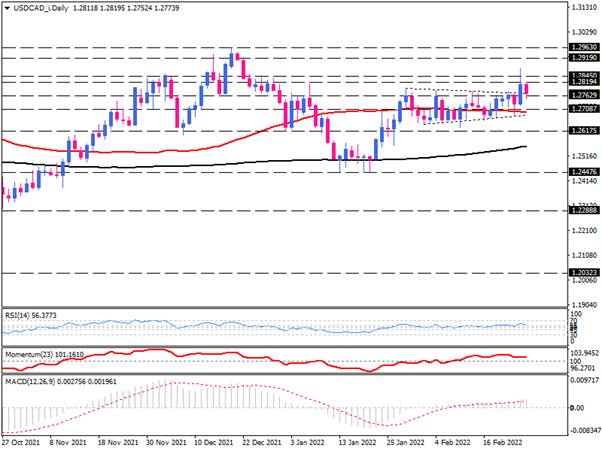
USD/CAD bulls defend the key support on the verge of the wedge
After breaking above its consolidation pattern, the USD/CAD continued to slide from its two-month high in Friday's trading. A report released by the Bureau of Economic Analysis on Friday indicates that the Core Personal Consumption Expenditures (PCE) Price Index increased by 5.2% YoY in January. The reading was higher than the median forecast for 5.1% and represented a significant acceleration from December's 4.9% level. Also, the MoM core PCE inflation rate was up 0.6%, above expectations of 0.5%, and slightly higher than December's 0.5% rate. FX and other markets appear not to have significantly reacted to the latest US data, with attention turned to geopolitical developments instead.
While the markets remain focused on the outcome of the NATO summit and the ongoing Russia-Ukraine crisis on Friday, pullbacks in crude oil prices weakened the commodity-linked Loonie and provided a modest boost to USD/CAD. Despite the intraday rise, investors failed to follow through on their hopes for a likely Russia-Ukraine ceasefire.
Technical view
From a technical standpoint, as can be seen on the daily chart, USD/CAD had been stuck within a wedge, but yesterday, buyers managed to break above this consolidation, creating a bullish scenario.
Should buyers maintain their position, a retesting of 1.28450 is expected. Getting there may require a pullback from 1.27629 aligned with the upper edge of the pattern, as the 50-day EMA with a negative slope does not suggest a sharp upside opportunity for the moment.
If USD/CAD continues to gain traction off the 1.28450 hurdle, bulls would aim for the classic wedge target at 1.29190. By breaking through this barrier, the upside constraint could unfold around a multi-year peak of around 1.29630.
Nevertheless, on the downside, if the price slips back below the upper line of the wedge, the 50-day EMA can act as support since it is in line with the lower line of the consolidation pattern.
The momentum oscillators signal the upside tendency of the market. The RSI has risen out of the neutral zone, and the momentum is soaring to a greater extent, indicating a positive bias. In addition, we have positive MACD bars rising marginally above the signal line.

Technical Analysis
Discover ideal profit opportunities for your everyday trading with the help of our in-depth technical insights comprised of facts, charts and trends.


