

US dollar index heads for two-year highs
The dollar opened higher on Monday and extended gains to test the March 14 highs. In light of the broad sell-off in the bond markets, a further advance of just 0.1% would put the dollar at its highest level since May 2020. Due to rising inflation and interest rate fears, Monday, the US and European bond yields hit record highs.
Two-year Treasury yields hit a record high since early 2019 at 2.41% on expectations that the Fed will increase its efforts to tame inflation. Moreover, the 10-year yields surged to new highs above 2.5%. Furthermore, the gap between 5-year and 30-year Treasury yields also inverted for the first time since 2006, indicating elevated concerns about an impending slowdown. Market participants will continue to monitor the US economy's performance and the Federal Reserve's plans for upcoming interest rate hikes. Nonfarm payrolls will be released on Friday, with economists expecting the US economy to have added 475,000 jobs after adding 678,000 in February.
Further, February's personal income and spending figures will be announced on Thursday. The upcoming core PCE price index is forecast to increase 5.5% annually in February, well above the Fed's inflation target of 2%.
Technical view
The 4-hour chart shows that the dollar has broken the symmetrical triangle pattern upward after a period of consolidation between 98.96 and 98.40. As a result, the index is now trading near the key level of 99.22, which marks the top of March 14. Assume buyers manage to overcome this roadblock. The greenback could be setting its sights higher, and bulls will likely target the 99.42 resistance level, the highest point in almost two years. Upon crossing this barrier, the prevailing bullish momentum will carry the price upward to complete the classic projection of the pattern at 100.38.
Nonetheless, we can expect some consolidation at the 99.22-barrier, which can result in a pullback towards the previous level of interest at the 98.96 mark.
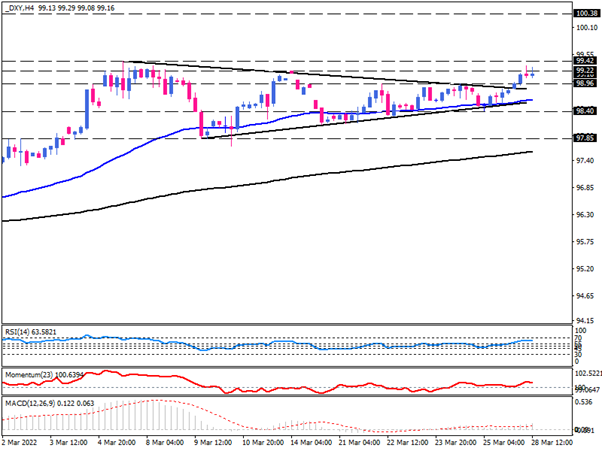
For the bearish scenario, if sellers breach the upper line of the pattern to the downside, the focus quickly shifts to the 50-EMA, which is aligned with the triangle support line.
According to momentum oscillators, buyers are in control of the market. The RSI indicates positive movement in the buying region, and momentum is above the 100-threshold. As well, positive MACD bars are rising above the ascending signal line.
Technical Analysis
Discover ideal profit opportunities for your everyday trading with the help of our in-depth technical insights comprised of facts, charts and trends.


