

The GBP/USD is testing key support during its upward trend
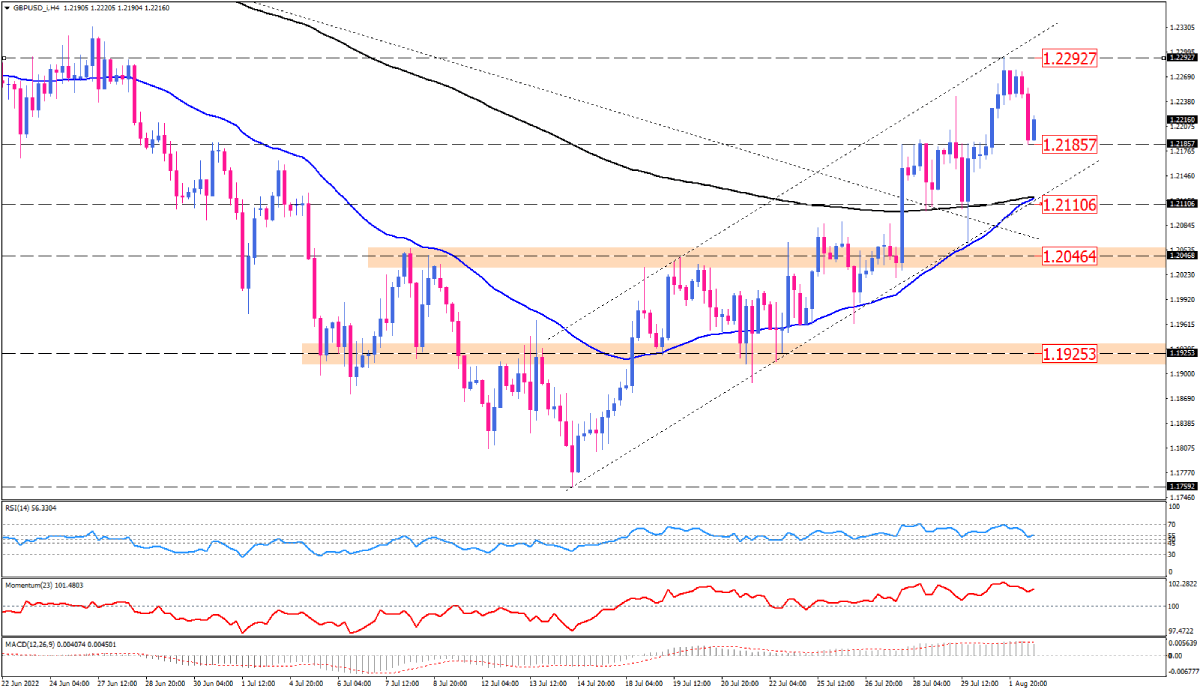
On the four-hour chart, the GBP/USD turned bullish after crossing above the 200-period EMA last week. Currently, the pair is trading within an ascending channel. Having made a new top at 1.22956, in line with the channel’s upper border, the price is hanging out around the 1.21857 support level. It is not surprising to see the pair consolidate around this barrier for some time since selling pressure is unlikely to be strong enough to wipe out the support level immediately.
As long as the pair sticks within the channel, the outlook remains positive for the pound, even if the recent sell-off is followed by a broader bearish pressure below the current support level. If the price declines further, it could reach the support area of 1.21106 along the 200-period and 50-period exponential moving average boundaries. With this confluence of support levels limiting losses, GBP buyers may succeed in making a new higher bottom, aiming for 1.21857.
Otherwise, a decisive channel violation would push the pair below the moving averages, keeping more sellers at the edge of their seats trying to get back to 1.20464.
Momentum oscillators point to a fading bullish bias within the short term. The RSI has fallen into the neutral territory after reaching 70-level. Momentum seems to be seeking lower levels during the upward trend it is following. Positive MACD bars are retreating from the signal line toward the zero line.
Technical Analysis
Discover ideal profit opportunities for your everyday trading with the help of our in-depth technical insights comprised of facts, charts and trends.


