

The AUD/CAD sellers take a break before drifting lower
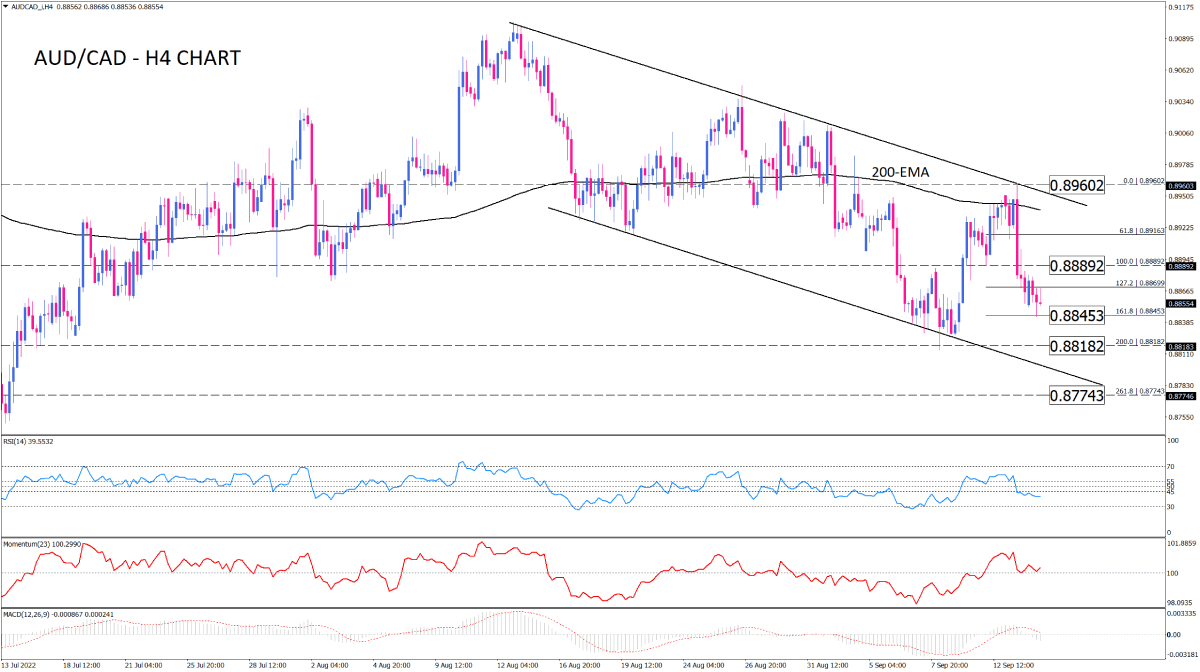
AUD/CAD on the four-hour chart is trading in a downtrend. The consecutive lower tops and bottoms have put the pair in a descending channel. The fall became more severe after the price hit the channel's upper border in the vicinity of the 200-EMA. Another piece of evidence from the chart is the break of the 0.88892 last market bottom, which has propelled further decline toward the 161.8% Fibonacci projection of the previous upswing. Sellers will likely take a breather around this crucial support for some time. However, if they keep driving the market below this hurdle, attention will turn to 0.88182, which is in line with the two-month low seen last week. Such a move will bring the channel's bottom border into the spotlight.
Otherwise, a bounce back to the broken support of 0.88892 might be in order if buyers regain control. Although, as long as the pair hovers below the 200-EMA, the broad picture remains bearish.
Short-term momentum oscillators imply a bearish tendency in the market. RSI has pulled out of the neutral zone to the downside, and momentum is down to the 100-base line. Likewise, the MACD histogram is dipping below zero, prompting the signal line to fall toward zero as well.
Technical Analysis
Discover ideal profit opportunities for your everyday trading with the help of our in-depth technical insights comprised of facts, charts and trends.


