

S&P500 bulls approaching 200-day EMA to form a reversal
After posting its best day in two years, the S&P500 futures index has been on a positive note on Friday. The importance of Thursday’s rally is that the index rose to a fresh high since September 19 breaking the 3920.3 key market top.
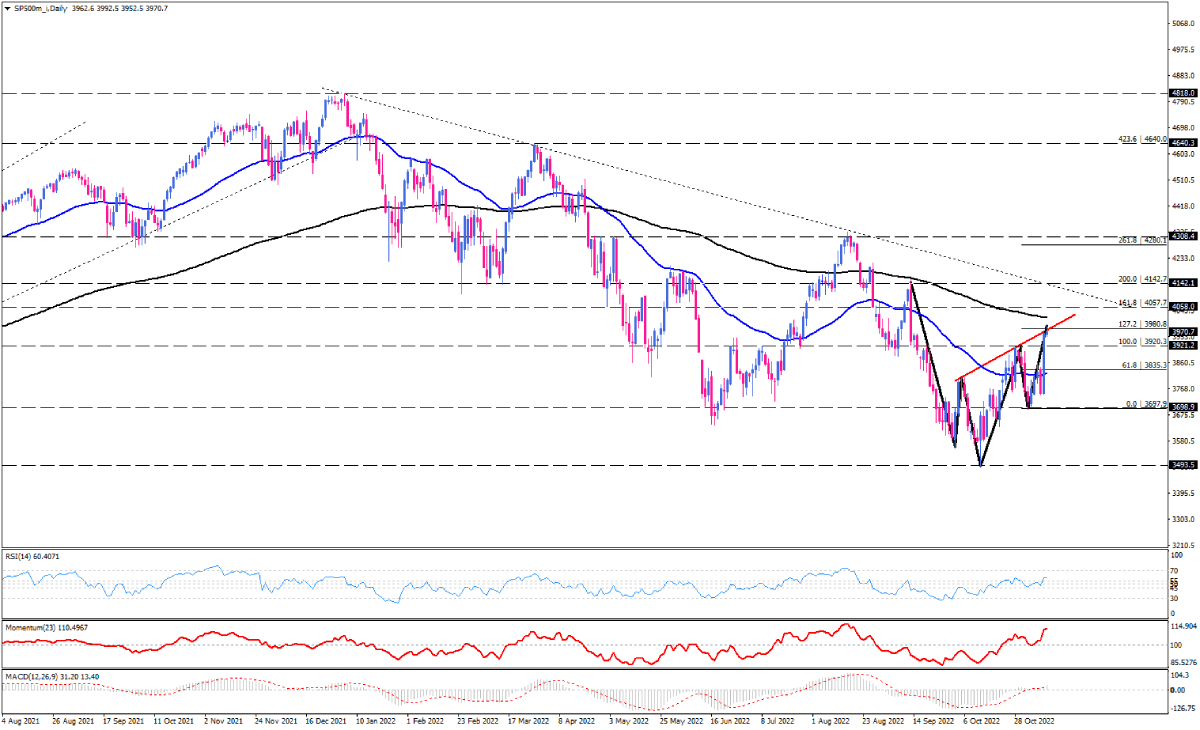
After making a higher bottom at 3697.9 on the 3rd of November, buyers overstepped the 50-EMA to pave the way towards the 200-day EMA ahead of the US market opening on Friday. Such a move has resulted in forming a head and shoulders pattern that caused buyers to be challenged by the neckline around the 3980.8 hurdle, which is in line with the %127.2 Fibonacci projection level of the last downswing from 3920.3 to 3697.9.
If buyers manage to overcome this obstacle while the major trend which began in January, is still downward, further positive traction can send the price to hit the 4057.7 barrier, coinciding with the %161.8 level of the Fibonacci projection. Eventually, overstepping this barrier can fuel the upside momentum having bulls meet the major resistance of the downtrend line at around the 4142.7 mark.
Otherwise, if sellers take back to their seats and push back bulls from the neckline the reversal pattern will still remain upheld but the immediate support can be estimated at 3920. However, bears need to get the price all way down below the right shoulder at 3697.9 to invalidate the bullish head and shoulders pattern.
Short-term momentum oscillators favour the bullish sentiment. RSI has entered the buying region after a period of sideways in the neutral zone. Momentum is also approaching its extreme in the buying area, above the 100-threshold. Likewise, MACD bars are battling the zero line to cross into the positive territory along with the rising signal line. But worth to mention that all now depends on that how the neckline will treat the rally.
Technical Analysis
Discover ideal profit opportunities for your everyday trading with the help of our in-depth technical insights comprised of facts, charts and trends.


