

NZD/CAD bulls plan to challenge the falling trendline
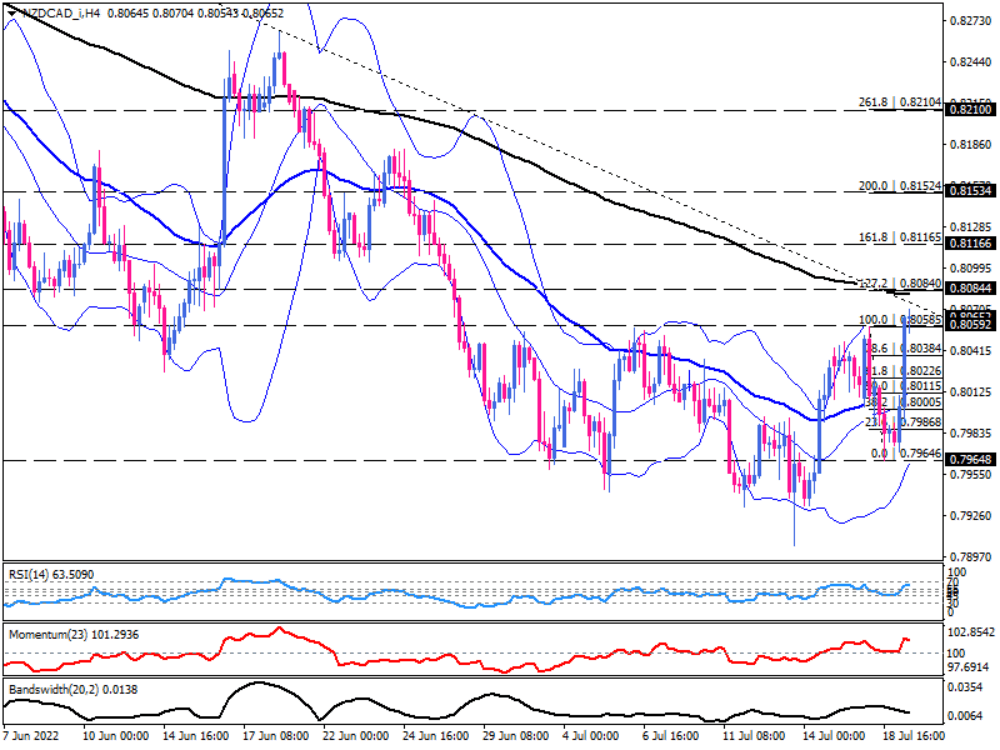
NZD/CAD is trading higher after hanging on a range between 0.80585 and 0.79646 for a while, with buyers aiming to form a short-term reversal to reach the 200-period EMA around 0.80840 on the four-hour chart.
Following a sharp pullback from the 50-period EMA, the upward momentum is struggling with a set of resistances as buyers attempt to keep the ground above the 0.80585 crucial level in line with the upper Bollinger band held for three weeks. Reinforcing buying pressure above the previous top may give the pair a chance to reverse the downtrend by challenging the 200-period EMA near 0.80840. If buyers are able to push through this barrier, the next step will be to attempt to break through the 0.81165 level, in line with the 161.8% Fibonacci projection.
Moreover, closing above the 0.80585 hurdle will also confirm the completion of a reversed head and shoulders pattern by penetrating the neckline connecting July 7 top to July 18 top. The pair will also remain on the verge of breaking through the falling trendline if it continues to move in that direction.
Alternatively, suppose sellers defend this resistance confluence. In that case, the pair may fall down to test the middle Bollinger band and the 50-period EMA around the 0.80115 handle. Further downside moves will put the last bottom at 0.79646 in the spotlight.
Momentum oscillators suggest that buying pressure may ease near the key resistance confluence. RSI is moving flat after climbing from the neutral zone to the buying area. Also, momentum has been paused near its recent extreme level above the 100-threshold. Another reason to not get too excited about the bullish run is the Bandwidth oscillator, which hints at converging bands. It means the market momentum is decreasing in terms of the Bollinger bands. We also have the price hanging out at the upper band, which can be considered a dynamic resistance level.
Technical Analysis
Discover ideal profit opportunities for your everyday trading with the help of our in-depth technical insights comprised of facts, charts and trends.


