

Gold bearish outlook after forming a reversal pattern
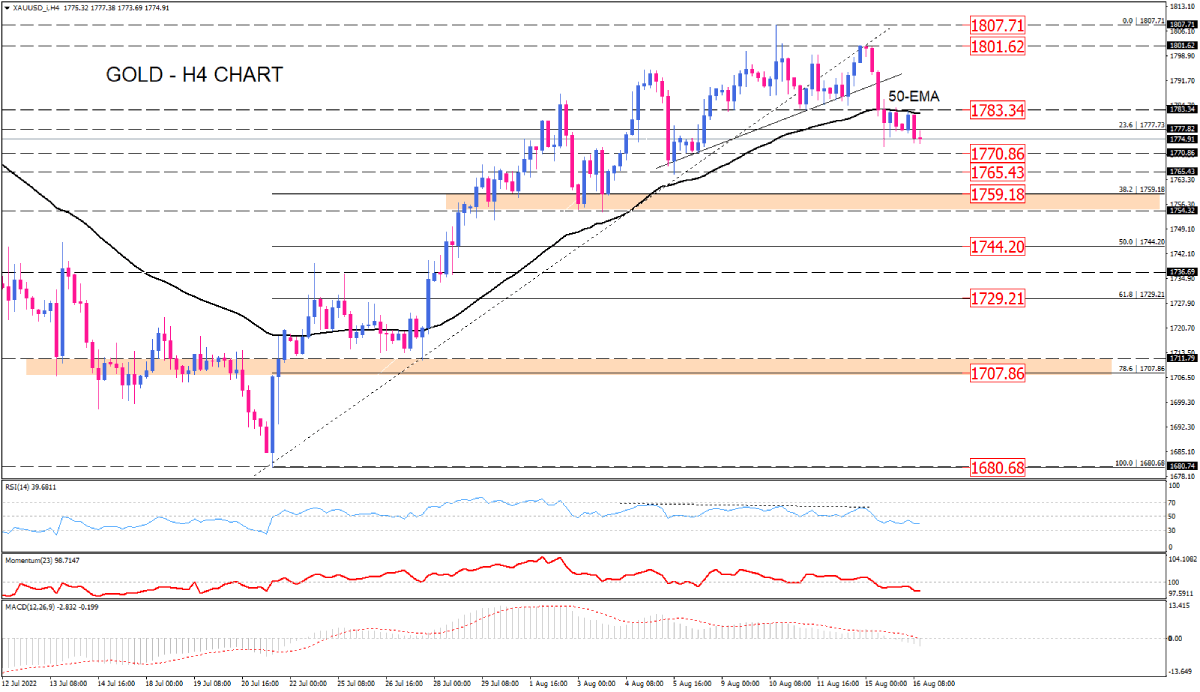
Gold on the four-hour chart has formed a bearish reversal pattern called head and shoulders. As price action depicts, the three-week uptrend has ended as buyers failed to recapture the market top at 1807.21. Moreover, weakening bullish bias resulted in the violation of the uptrend line, followed by a rebound. Afterwards, prevailing bearish momentum pushed the price back below the 50-EMA, hitting the 23.6% Fibonacci retracement of the prior uptrend, which lines up with 1777.75.
During Tuesday’s trading session, gold closed below this crucial level to trigger a bearish signal. More sellers are expected to take a clue and join the market, leading to further losses. The immediate support can come from the 1770 round level, which the market has reacted to it in the past. Should sellers pass this hurdle, the market bottom of August 5 at 1765.43 will go into the spotlight. Overcoming this barrier will send gold towards the 38.2% Fibonacci retracement level at 1759.18, which can lend plenty of support to the price.
On the upside, should buyers wake up, they will retest the 50-EMA around the previous level of interest at 1783.34. Overstepping this roadblock will pave the way toward the broken neckline. However, as long as the previous market top at 1801.62 keeps out of reach, the outlook is bearish.
Short-term momentum oscillators support the bearish outlook. RSI is pointing down in the selling region after posting a divergence. Momentum is moving below the 100-threshold, implying sellers are in charge. MACD has triggered a bearish signal with MACD bars crossing below zero. The signal line is also on the verge of crossing the base line into a negative area.
Technical Analysis
Discover ideal profit opportunities for your everyday trading with the help of our in-depth technical insights comprised of facts, charts and trends.


