

GBP/USD Challenging with a key support level
On Friday, retail sales in the UK decreased by 0.3% in February, as opposed to market expectations of deceleration to 0.6% from 1.9% growth in January. Moreover, sales excluding fuel fell 0.7% and missed market projections of 0.5%.
As for the US dollar has pared some of its intraday losses by drawing some support from rising bets on a 50 bps rate hike by the Fed in May. Bears await a decisive break below the ascending flag support, as fundamental news prompted downward pressure on the GBP/USD pair. The rest of the day is expected to be dominated by Fed officials' speeches, which may reinforce the hawkish stance and offer more support to the dollar.
Technical view
The pound has exhibited a bearish flag against the US dollar on the four-hour chart, struggling with the 50-bar EMA. Sterling is currently trading in a range market, fluctuating between 1.32242 and 1.31526, corresponding to a 23.6% Fibonacci retracement of the prior downtrend. As it turns out, sellers tend to violate this key support area at the confluence of 50 EMA, lower flag line, and 23.6% Fibo level. Yet, there are still no signs of a bearish trend, and we will need a clear break out before we can pinpoint a direction.
The bearish scenario could play out if sellers break below the 1.31526 hurdle and drag the 1.31377 level into the spotlight. Continuing below this level can push the pair towards 1.31142. If the negative momentum continues, GBP/USD can then move lower towards the 1.30882 barrier.
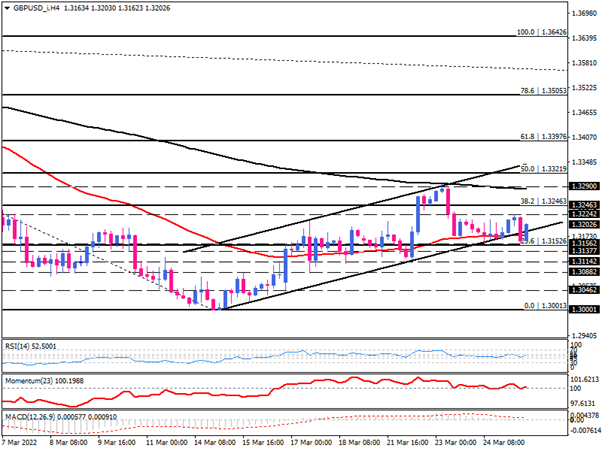
By contrast, if 1.31526 holds, the pair will likely remain sideways, aiming for the range top at 1.32242. Breaking this barrier could lead to buyers reclaiming 1.32463, which is in line with the 38.2% Fibonacci level. In the event of a breach of this latter, the move toward 200-bar EMA could speed up.
The short term momentum oscillators paint a mixed picture. The RSI is floating in a neutral region with no apparent direction. Also, momentum has drawn a sideways movement attached to the 100-baseline. Similarly, MACD bars are positive but shrinking towards zero, indicating fading directional momentum.
Technical Analysis
Discover ideal profit opportunities for your everyday trading with the help of our in-depth technical insights comprised of facts, charts and trends.


