

GBP/CHF bulls retreat from the triangle's resistance
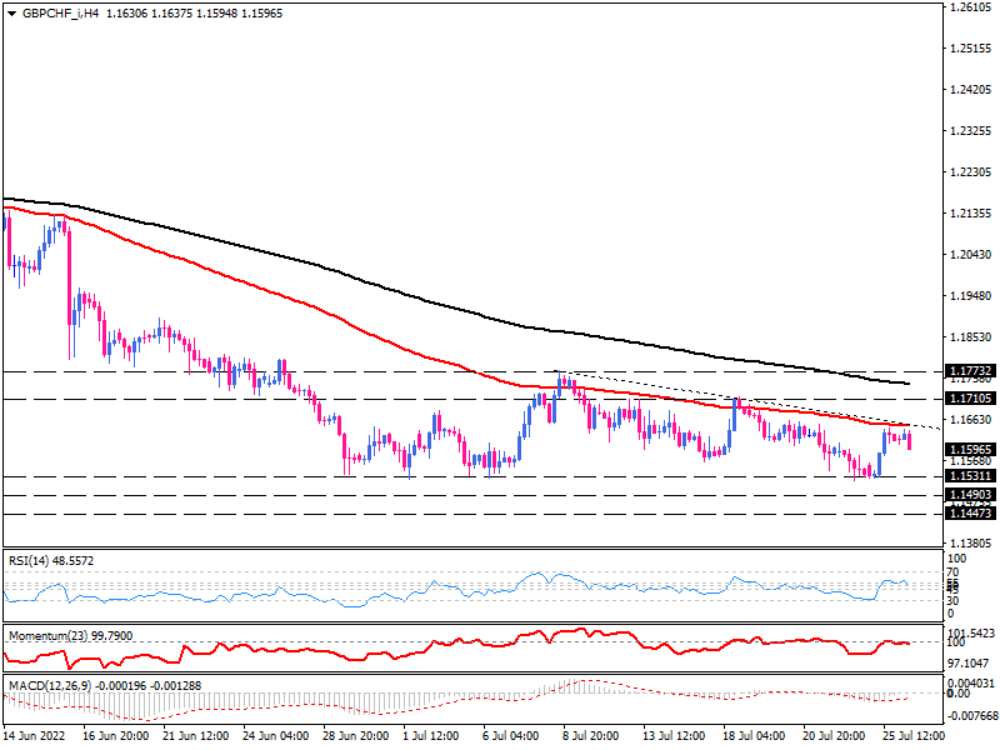
GBP/CHF was in a downtrend until the 1.15300 hurdle limited the further decline. As seen on the four-hour chart, the price has stuck in a descending triangle, making lower tops. On Tuesday, the pair is hovering around the triangle's resistance border at the confluence with the 100-period exponential moving average.
If more sellers make a cue from the pattern, the dynamic resistance of 100-EMA and falling triangle line will be more likely to hold than to break. That means selling pressure can remain in play and drag the pair down to meet the pattern's lower border, lying at the 1.15300 mark.
If selling momentum persists, the price can break below this barrier and trigger a sell-off, sending the pair towards the 1.14900 mark.
Otherwise, a sustained move above the confluence of 100-EMA and the pattern's boundary would hint at increasing buying interest in GBP. If that is the case, the next resistance could confront the rally around the previous peak of 1.17106. Further traction above this barricade will put the 200-EMA in the spotlight.
Momentum oscillators suggest bearish momentum is likely to prevail. RSI is pointing down after crossing below the 50-level. Momentum is also moving lower in the selling area after hitting the 100-threshold. However, MACD bars are on the verge of the zero-line following a continuously shrinking above the signal line.
In conclusion, GBP/CHF bulls have retreated around a significant resistance zone. Still, the pair is waiting for intensifying bearish momentum to keep its path towards the key resistance level of 1.15300.
Technical Analysis
Discover ideal profit opportunities for your everyday trading with the help of our in-depth technical insights comprised of facts, charts and trends.


