

Following targets for gold after a decisive breakout
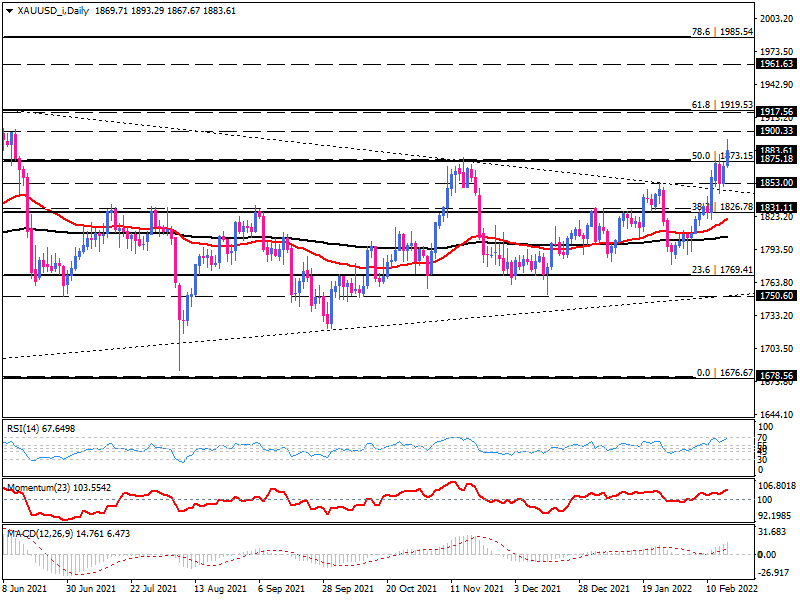
The daily chart shows that bulls have eventually made a breakout above the dynamic resistance out of the triangle pattern. However, a breakout was confirmed as today's rally cleared the 1875 hurdle at a three-month high, along with the 50% Fibonacci retracement of last year's downswing.
Accelerating bullish momentum can lead the market towards the psychological level of 1900. We can expect some consolidation or even some correction at this level. If fundamentals support the rally, buyers may gather more power to drive the market higher. Upon a substantial break above 1900, the next resistance will be the boundary between 1917 and 1922, which lies on the 61.8% Fibo retracement. Moving averages are endorsing an upside bias, with the 50-day EMA gaining a positive slope above the 200-day EMA.
Momentum oscillators reflect intensifying bullish sentiment. RSI is running underneath the 70-level, and momentum is trending upward in the buying region. And MACD bars are growing above the zero-line and above the upward signal line.
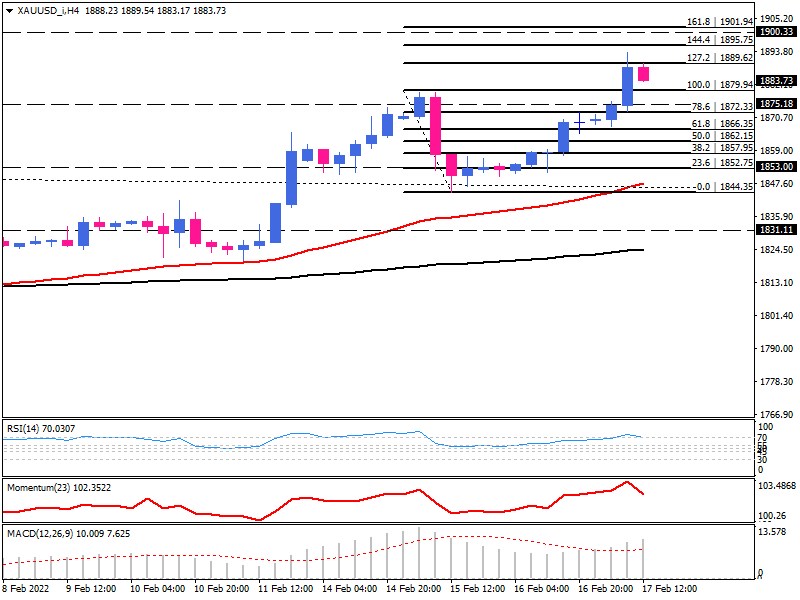
The four-hour chart depicts the upside break more precisely. Buyers have already cleared the previous swing top at 1879. Currently, they are challenging the 127.2% Fibo-extension corresponding to 1888 dollars. Overcoming this barrier will place 1894 in the spotlight before achieving the 1900 psychological level.
On the downside, gold may pull down and retest the 1875 dollars if selling forces retake control. A decisive break below this level will encourage more sellers to run towards the broken triangle upper line around 1844.
Momentum oscillators suggest the market is at an extreme. RSI is in overbought territory, and momentum is at multi-month record highs. At the same time, the rising MACD bars above the signal line indicate the prevailing bullish bias.
Technical Analysis
Discover ideal profit opportunities for your everyday trading with the help of our in-depth technical insights comprised of facts, charts and trends.


