

EUR/GBP bears keep eye on 0.83 again
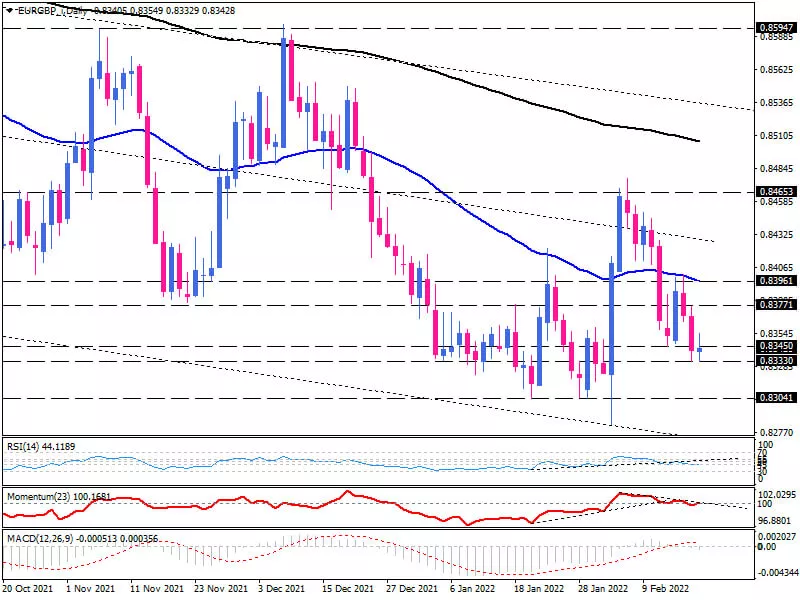
EUR/GBP which is currently trending downward below the 50 and 200-day exponential moving averages. On the daily chart, EUR/GBP has been trading within a falling channel for a year. Since hitting resistance at 0.8465, the pair has expanded its falling trajectory. Sellers now appear to be preparing for the next support area between 0.830 and 0.8282. Which coincides with the lowest price in the last five years.
While momentum oscillators are signalling an improvement in selling forces, they aren't fully supporting sellers' dominance. The RSI has dropped below the neutral zone and appears to be entering a downtrend. Momentum is around 100-baseline, but it is experiencing lower highs and lower lows. MACD bars are also dipping down deeper into the selling area, but the downward signal line is still in the positive area.
Short-term view
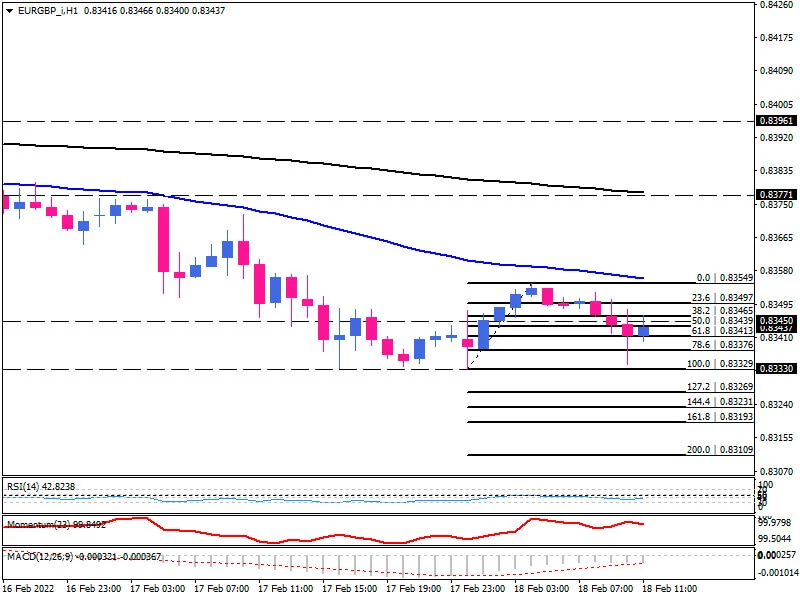
One hour chart, we see the broad picture is still bearish, and the pair is on the back foot towards the previous bottom at 0.8333. if the downward move finds enough momentum to pass this hurdle, the immediate support will come at 0.8327. overstepping this barricade may lead the price towards 0.8323 and 0.8319, respectively. If negative momentum persists, sellers will keep their eyes on the 0.8310 mark.
Otherwise, if buyers step in and retake control, the immediate resistance will initiate around the last top of 0.8354 in line with the 50-EMA. Getting past this roadblock could propel the price higher to 0.8377, aligned with the 200 EMA.
Momentum oscillators indicate a tendency to keep falling. The RSI is down in the selling area, and momentum has risen slightly but is still on the sell-side. MACD bars also show growth in the negative region, although they are above the signal line.
Technical Analysis
Discover ideal profit opportunities for your everyday trading with the help of our in-depth technical insights comprised of facts, charts and trends.


