

EUR/AUD heading for critical support as uptrend loses steam
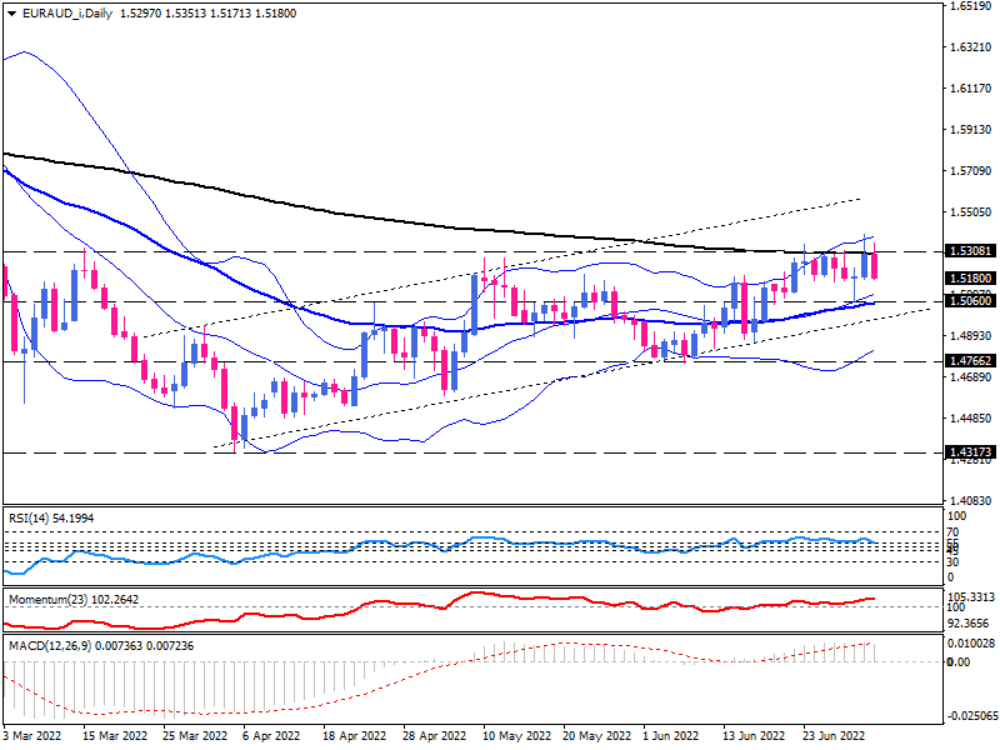
EUR/AUD is trading in a bullish channel after falling to a five-year low at 1.43173 in an upside corrective wave. The pair has already hit the 200-day exponential moving average, which lines up with the solid resistance area of 1.530. As seen on the daily chart, This area had previously posed a barrier to the upward rally in mid-March, May, and late June, and it appears that it has done so once again this time. In addition, the price is in the upper half of the Bollinger Bands, which indicates a bullish market.
For the time being, EUR/AUD is trading between the 1.530 resistance and the 1.5060 support. The upcoming direction of the market will be determined by a break on either side of this range. On Monday, the price dipped on the back of the superiority of sellers. If the intensifying momentum persists, the pair can continue to fall to the previous price floor at 1.5060. This area is located at the confluence of the 20-day SMA and 50-day EMA, which also contains the lower edge of the ascending channel, making it a very reliable support area.
If sellers overcome this obstacle, a double-top reversal pattern will form, and the price will enter the lower half of the Bollinger Bands.
An M reversal pattern is forming after a relative lower top made on Friday in terms of the Bollinger bands, as the previous relative high was outside the bands on June 23. Still, on Friday, the price recorded another high inside the bands, signalling a decrease in upward momentum and the possibility of a reversal. The convergence of the Bollinger bands also confirms that upside momentum is running out of steam in the short term.
A break of the ascending channel could send the price to the lower band around the previous price floor at 1.47662.
Otherwise, if 1.5060 holds support, buyers will regain control. But the continuation of the upward trend will require breaking the strong resistance zone of 1.530.
Momentum Oscillators indicate a weakening of buying forces but have not yet provided any indication that sellers are capable of reversing the trend. The RSI has stopped moving higher in the buying zone, and the momentum is above the 100-threshold but moving gently. The positive MACD bars have also shortened, falling below the signal line.
Technical Analysis
Discover ideal profit opportunities for your everyday trading with the help of our in-depth technical insights comprised of facts, charts and trends.


