

CAD/CHF bulls face 50-day EMA to extend the rally
CAD/CHF bulls seem to be trying to shape a reversal on the daily chart. Since posting the lowest level YTD around 0.71120 on September 30, the buyers have been in control, leading the price towards the 50-EMA. However, it might be too soon to claim a continuation to the bullish ride as Thursday’s trading indicate that this solid resistance has halted the rally so far, while short-term momentum oscillators are awaiting an acceleration to the upside to confirm such a movement. RSI shows bulls are strengthening to pull out from the neutral zone. Likewise, momentum is struggling with its threshold to get into the buying region. Still, shrinking MACD bars imply fading bearish bias that can be interpreted as a short-term balance rather than a bullish confirmation.
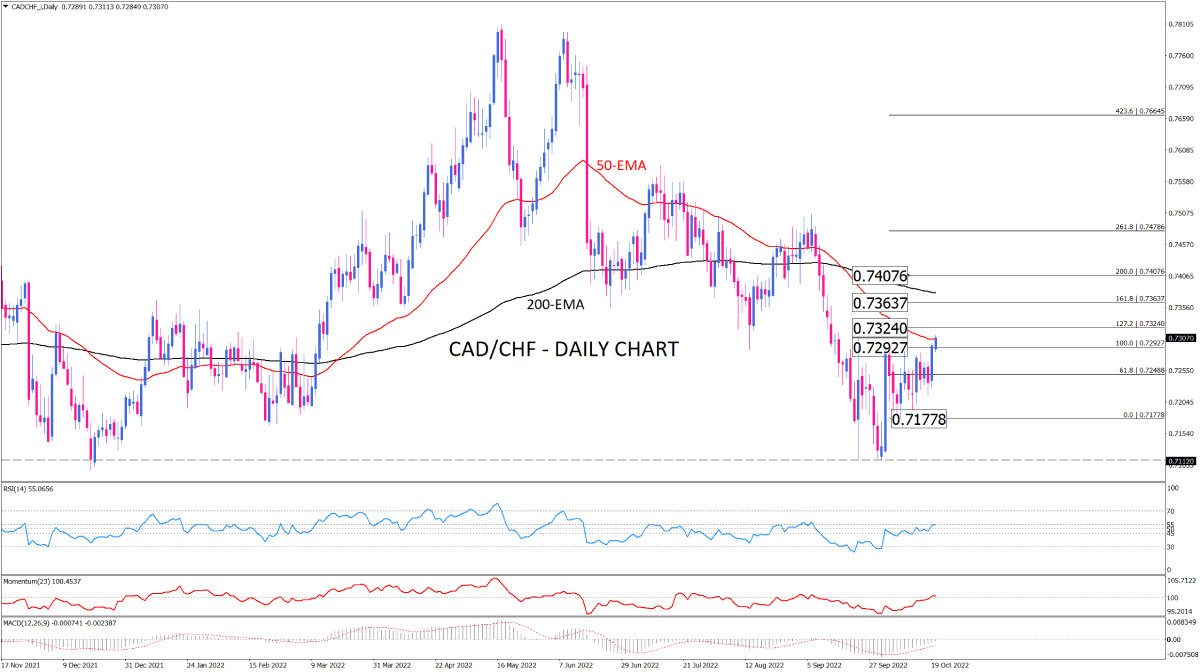
If buyers manage to break past the 50-EMA hurdle and close the session above this resistance, the immediate target for them can be estimated at around 0.73240. In the event that positive momentum picks up the price above this barrier, CAD/CHF will get on its way towards 0.73637, which is in the vicinity of 200-EMA and the 161.8% Fibonacci projection of the last downswing from 0.72927 to 0.71778. overstepping the confluence of these resistances will put 0.74076 in buyers’ sight.
Otherwise, should the 50-EMA cap further rise, sellers will take the ground and we can expect more sideways. With increasing downside risks the price may fall back to retest the previous bottom around 0.71778.
Technical Analysis
Discover ideal profit opportunities for your everyday trading with the help of our in-depth technical insights comprised of facts, charts and trends.


