EUR/USD recovers after final Eurozone inflation reading
- EUR/USD recovers after the release of HICP inflation data for the Eurozone.
- Speeches by several key ECB governing council members could also impact EUR/USD.
- EUR/USD enters oversold levels on the daily chart, indicating risk of a pullback.
EUR/USD rebounds by about two-tenths of a percentage point into the mid 1.0600s on Wednesday after the release of the final estimates for Eurozone March Inflation data.
EUR/USD: recovers after final estimates, ECB speeches
EUR/USD saw a lift on Wednesday after the final reading of the Harmonized Index of Consumer Prices (HICP) came out in line with the iinitial estimates at 2.4% year-on-year. This was down from 2.6% YoY in February.
The Core HICP showed a 2.9% rise YoY also in line with flash estimates, from 3.1% in February. Month-on-month readings were also in line with initial estimates.
The lack of change in the final estimate may have taken the heat out of increasingly dovish expectations regarding interest rates. A rate cut in June is now widely expected, and since lower interest rates, or their expectation, tend to reduce foreign capital inflows, this has been depreciating the Euro (EUR) and pushing down EUR/USD.
The market may have been expecting more of the same but in the absence of fresh cues from the HICP data actually began a relief rally after the news.
Speeches by key ECB members throughout the day, including ECB Executive Board Member Piero Cipollone, ECB Executive Board Member Isabel Schnabel and President Christine Lagarde herself could also impact the pair’s volatility.
The case for an imminent cut in interest rates – the ECB’s key main refinancing operations rate stands at 4.50% – was strengthened on Tuesday after ECB President Christine Lagarde said that the ECB will cut rates soon, bar a surprise, and that the ECB was keeping a close eye on Oil prices due to tensions in the Middle East.
The pair has been in the oversold zone on charts, increasing the odds of an upward correction potentially evolving on the horizon.
Technical Analysis: EUR/USD bears are oversold
The EUR/USD pair is firmly in a downtrend on both its short and medium-term time frames, since peaking and rolling over at 1.1139 in December.
EUR/USD Daily Chart
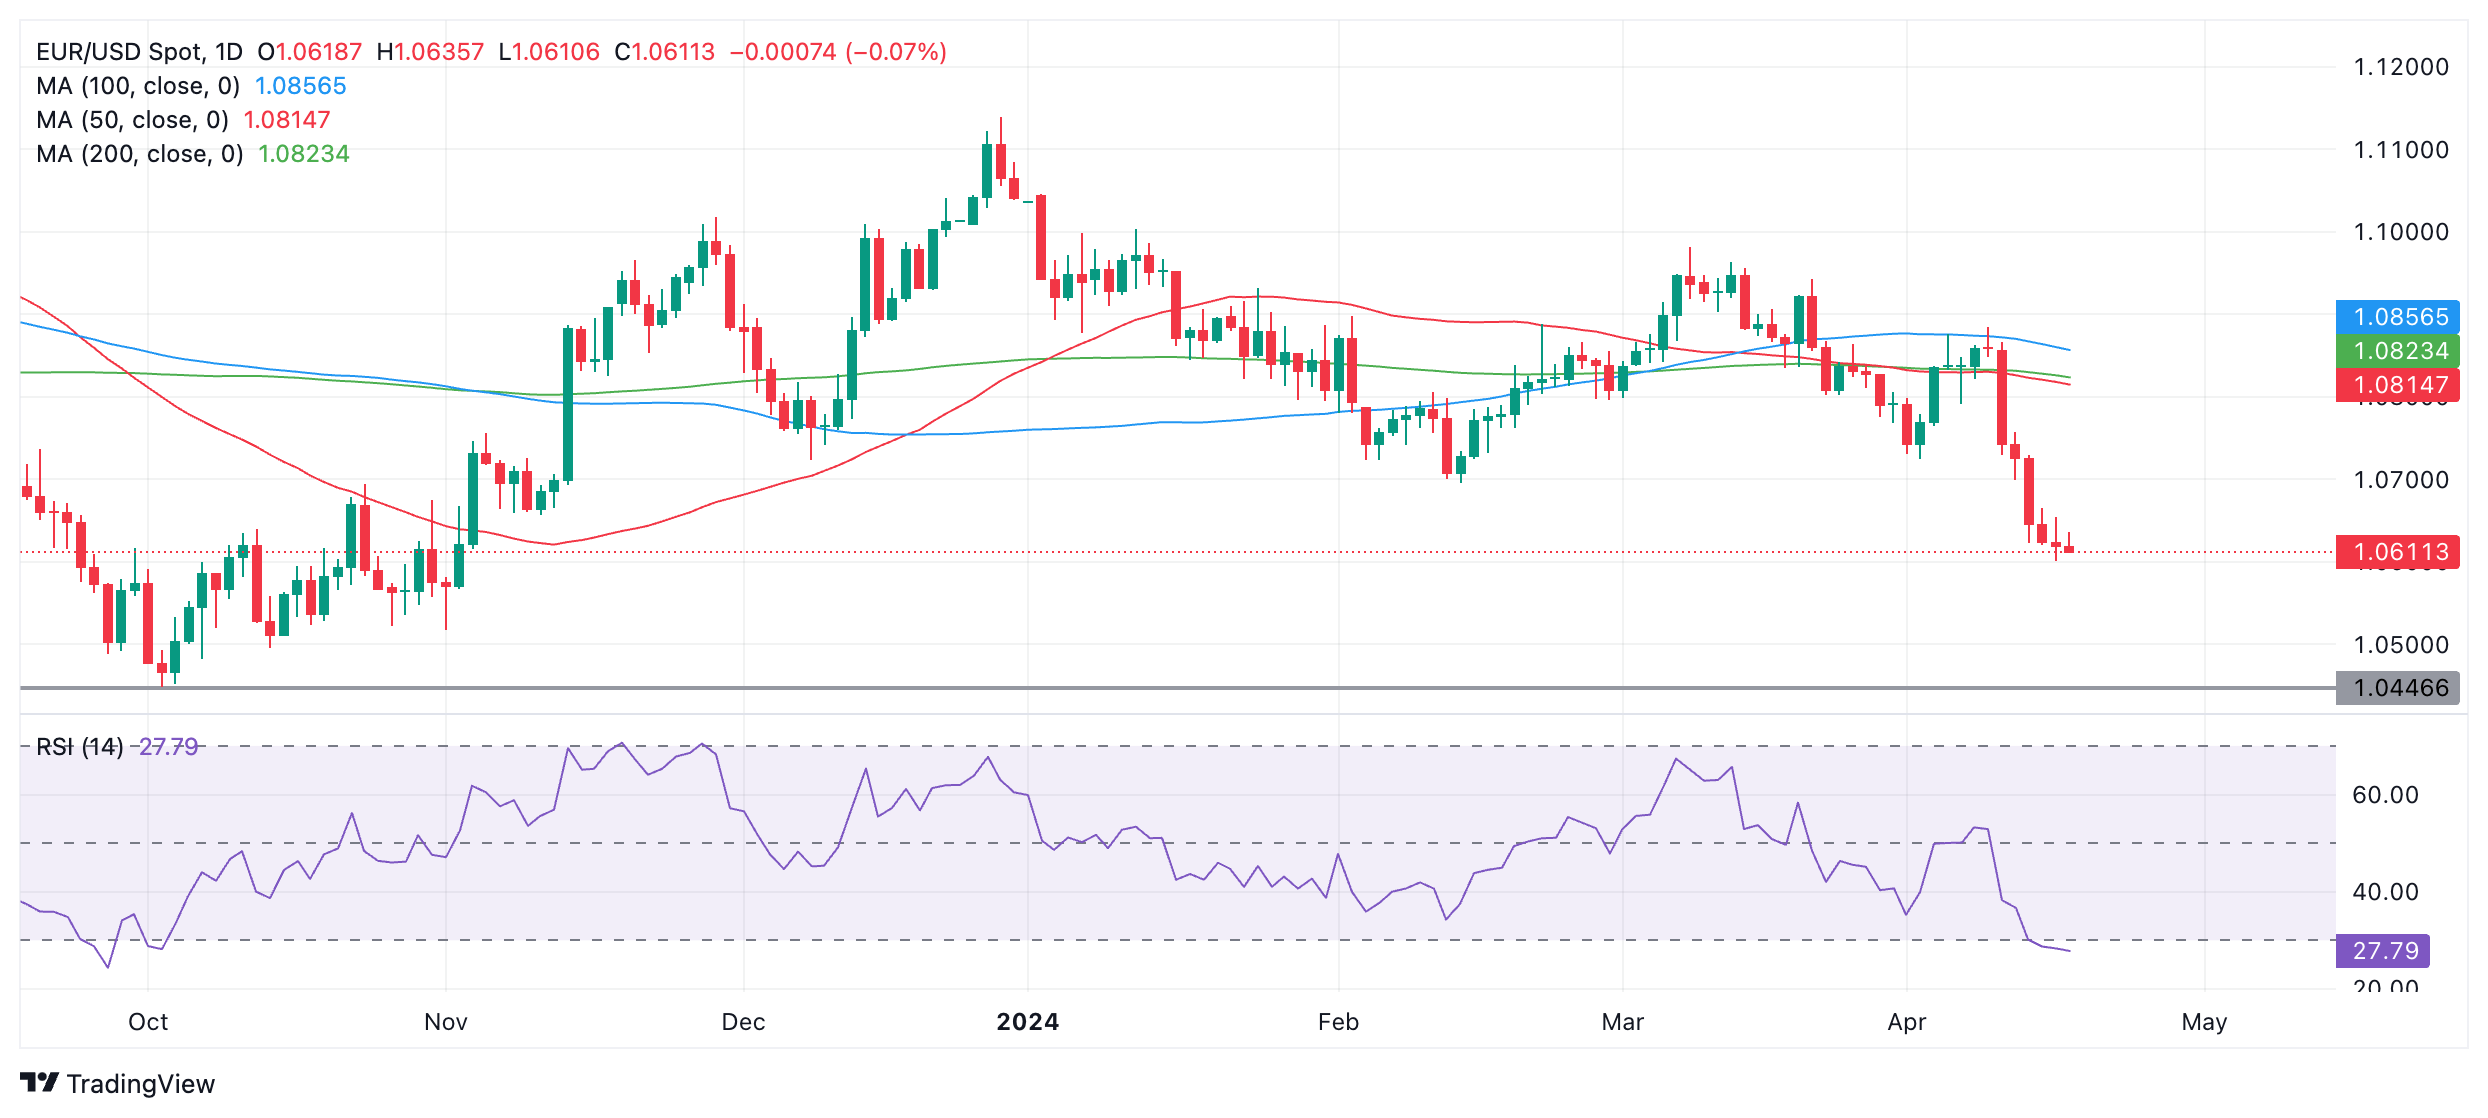
The downtrend thesis is supported by the fact that the pair is trading below all its key major moving averages – the 50-day, 100-day and 200-day Simple Moving Averages (SMA).
It is making lower lows and lower highs and this trend is biased to continue – with one caveat.
The Relative Strength Index (RSI) momentum indicator is flashing oversold on the daily chart. At the moment this is only a warning for short-traders not to add to their positions, however, if the RSI were to exit oversold and rise back above 30, it would be a sign the pair was correcting and for short-traders to close their positions and open longs.
As things stand it is still possible the pair could continue lower and even if there is a correction the dominant downtrend is still likely to resume. The next key downside target for the pair is the 2023 lows at 1.0446.
If a pullback evolves, meanwhile, a possible target could be the swing low at 1.0700.
(This story was corrected on April 17 at 13:40 GMT to say that the EUR/USD saw a lift on Wednesday not Tuesday as previously written.)
Inflation FAQs
Inflation measures the rise in the price of a representative basket of goods and services. Headline inflation is usually expressed as a percentage change on a month-on-month (MoM) and year-on-year (YoY) basis. Core inflation excludes more volatile elements such as food and fuel which can fluctuate because of geopolitical and seasonal factors. Core inflation is the figure economists focus on and is the level targeted by central banks, which are mandated to keep inflation at a manageable level, usually around 2%.
The Consumer Price Index (CPI) measures the change in prices of a basket of goods and services over a period of time. It is usually expressed as a percentage change on a month-on-month (MoM) and year-on-year (YoY) basis. Core CPI is the figure targeted by central banks as it excludes volatile food and fuel inputs. When Core CPI rises above 2% it usually results in higher interest rates and vice versa when it falls below 2%. Since higher interest rates are positive for a currency, higher inflation usually results in a stronger currency. The opposite is true when inflation falls.
Although it may seem counter-intuitive, high inflation in a country pushes up the value of its currency and vice versa for lower inflation. This is because the central bank will normally raise interest rates to combat the higher inflation, which attract more global capital inflows from investors looking for a lucrative place to park their money.
Formerly, Gold was the asset investors turned to in times of high inflation because it preserved its value, and whilst investors will often still buy Gold for its safe-haven properties in times of extreme market turmoil, this is not the case most of the time. This is because when inflation is high, central banks will put up interest rates to combat it. Higher interest rates are negative for Gold because they increase the opportunity-cost of holding Gold vis-a-vis an interest-bearing asset or placing the money in a cash deposit account. On the flipside, lower inflation tends to be positive for Gold as it brings interest rates down, making the bright metal a more viable investment alternative.
Forex News
Keep up with the financial markets, know what's happening and what is affecting the markets with our latest market updates. Analyze market movers, trends and build your trading strategies accordingly.