Gold price pushes down to $2,300 threshold after US employment costs rise
- Gold price falls on improving risk sentiment and an higher-than-expected rise in US employment costs.
- Positive gains in Asia, strong US earnings and robust European GDP data have all helped boost sentiment.
- Gold price may be unfolding a Measured Move price pattern lower on the charts.
The Gold price (XAU/USD) weakens to just above the $2,300 level during the US session on Tuesday, on the back of a positive market mood denting safe-haven demand for Gold and data from the US showing a rise in employment costs that could have negative implications for inflation and interest rates going forward.
Markets in Asia-Pacific closed on the whole in positive territory, with the Nikkie posting a 1.24% gain, Australia’s ASX200 up 0.35% and the Hang Seng rising 0.1% at the close. Caixin Chinese Manufacturing PMI hit a 14-month high in April whilst in Europe, French and Spanish GDP growth pre-empted a higher-than-expected rise in the Eurozone Q1 GDP, data showed on Tuesday.
The US Dollar (USD) – which is negatively correlated to Gold price – also rose after the release of the US Employment Cost Index showed a 1.2% rise in Q1, data from the US Bureau of Labor Statistics (BLS) showed on Tuesday. The data beat expectations of a 1.0% increase and the 0.9% of the previous quarter.
It is another indication of persistent inflationary pressures in the US economy. Higher employment costs are a sign of rising wages and often result in higher inflation. This in turn could persuade the Federal Reserve (Fed) to further delay the time when it decides to reduce interest rates, which is likely to appreciate the USD since higher interest rates for longer lead to greater capital inflows.
Gold price rally driven by Central Banks and OTC buying – World Gold Council
The Gold price rally in Q1 was driven by a combination of strong central bank and OTC buying, according to a recent report by the World Gold Council (WGC).
Total demand during the period was estimated at 1,238.3 tonnes compared to 1,269.7t in the previous quarter.
Over-the-Counter, or OTC buying – which is not conducted via exchanges and so can only be estimated – rose by 136.4t compared to 126.9t in Q4.
Heavy buying by central banks was a contributing factor in the rally in Gold price, with 289.7t of Gold bought by this market compared to 219.6t in the previous quarter.
“Q1 saw no let-up in the pace of central bank gold buying: 290t (net) was added to official holdings,” said the report.
Further details from the WGC report are as follows:
- Gold mine production increased 4.0% YoY to 893t – a record first quarter for the WGC data series.
- Gold recycling climbed 12% YoY to 351t, the highest quarter since Q3 of 2020.
- Eastern investors exhibited different behavior to Western investors, whilst Western gold buying experienced healthy levels of profit-taking. “This contrasted with strong buying into the price surge in Eastern markets,” said the WGC report.
- Global Gold ETF holdings fell by 114t, with Europe and North America experiencing quarterly outflows.
- Demand from the jewelry sector remained healthy, given the price rally. Global jewelry consumption fell just 2.0%.
- Gold demand from the technology sector rose 10.0% YoY as the AI boom boosted buying from the tech sector.
Technical Analysis: Gold price possibly unfolding Measured Move
Gold price (XAU/USD) is potentially unfolding the final down wave of a Measured Move price pattern, most clearly visible on the 4-hour chart, which technical analysts use to analyze the short-term trend.
XAU/USD 4-hour Chart
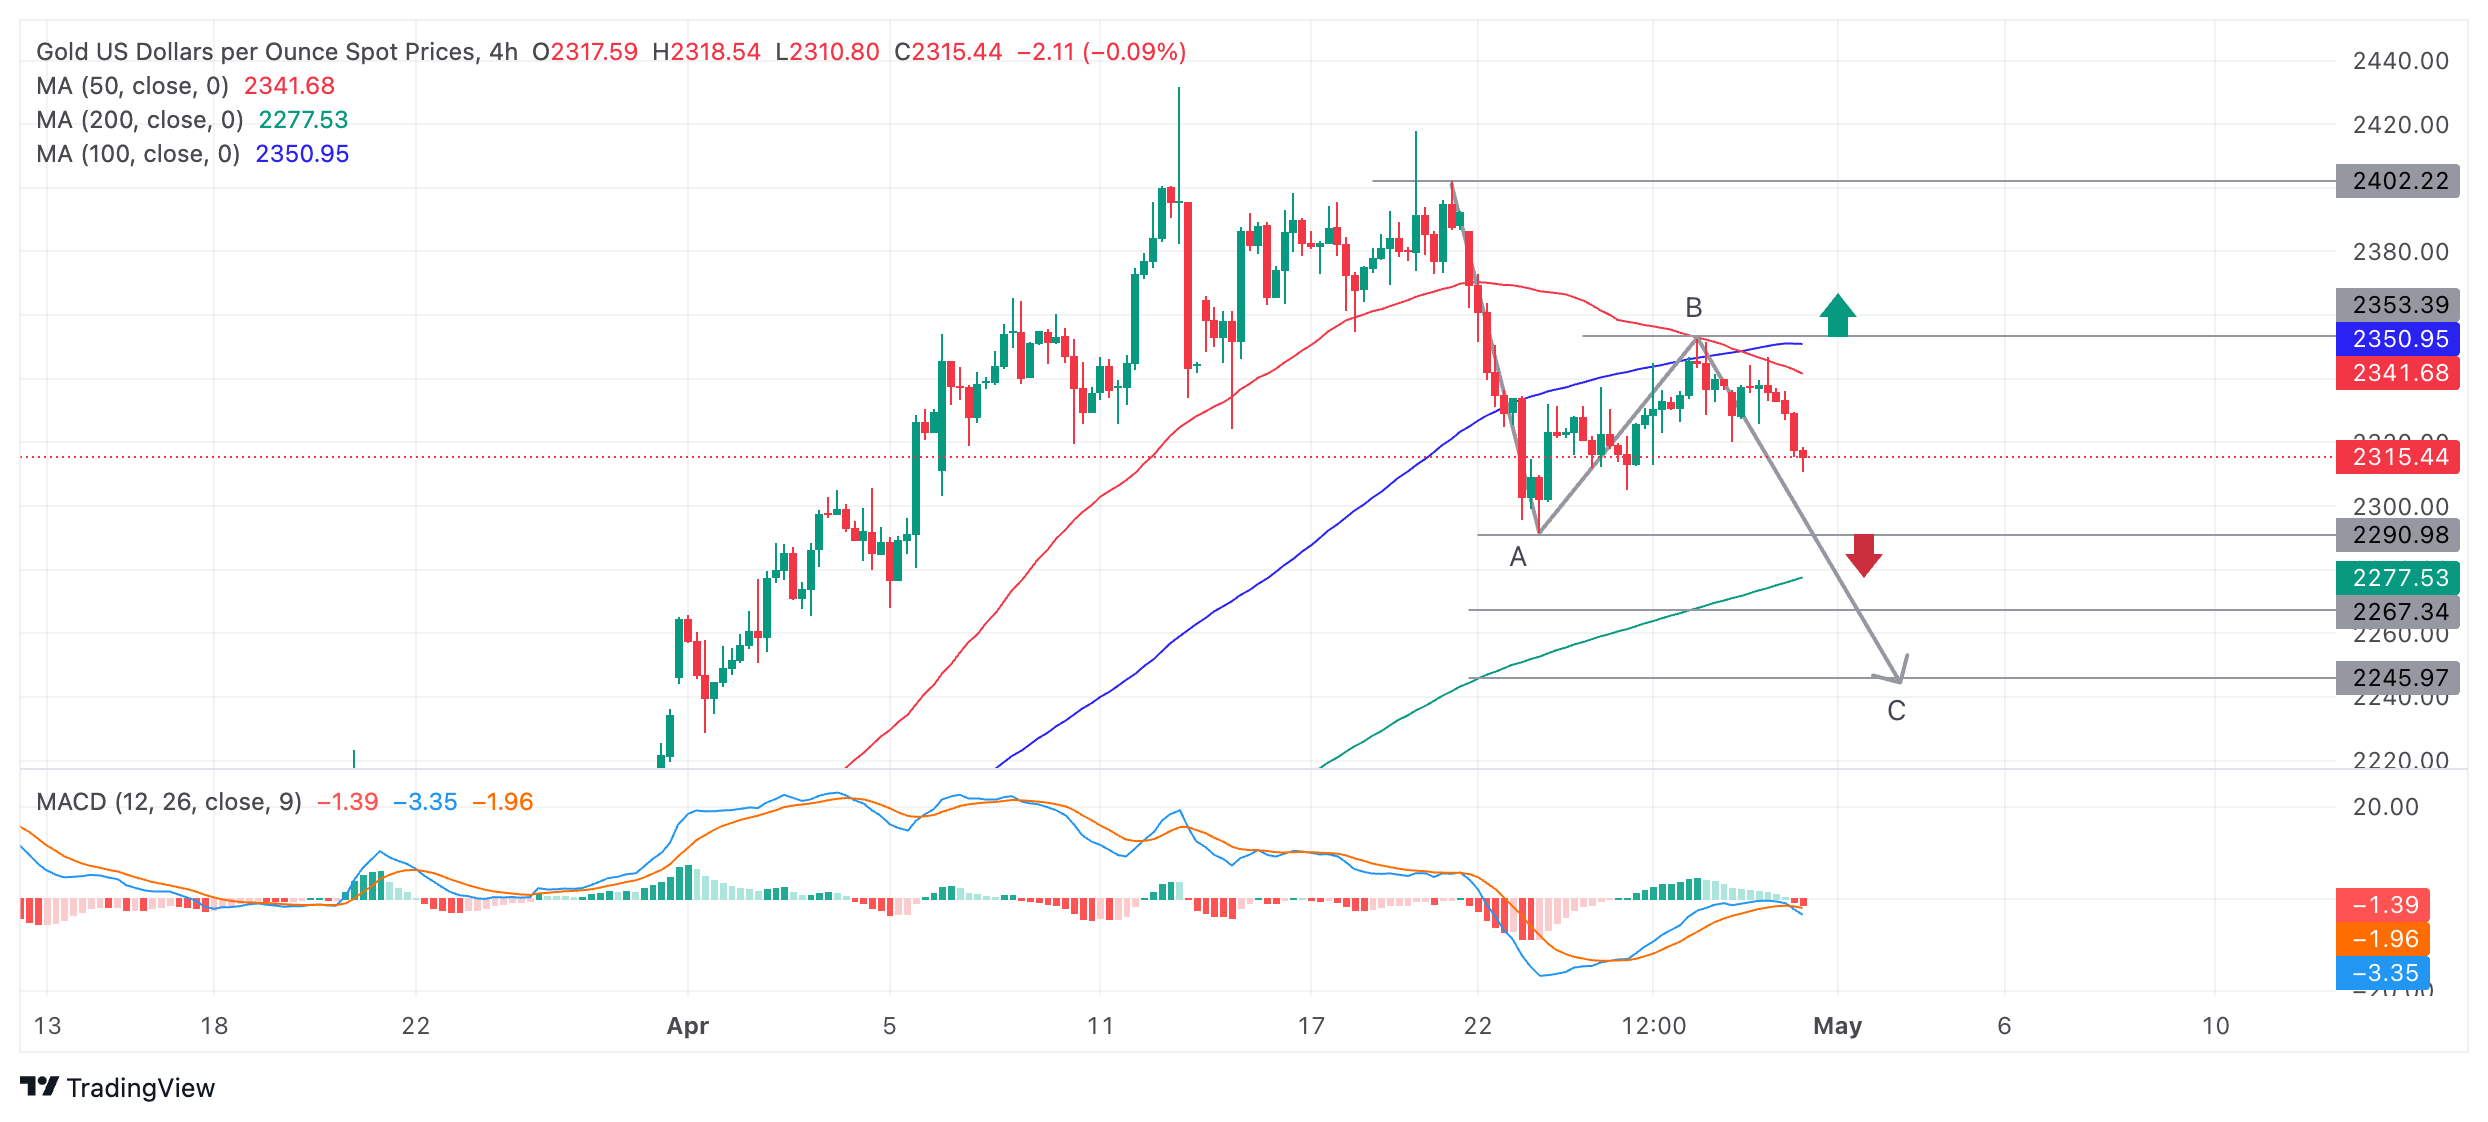
Measured Move patterns are composed of three waves that trace out a zig-zag pattern. The waves are often labeled A, B and C. The end of the final C wave can be estimated based on the length of wave A. It is usually either equal in length to A or a Fibonacci 0.681 ratio of A.
A break below $2,290, however, would confirm the pattern is a Measured Move and lead to more downside as wave C unfolds, with targets at $2,267 (the 0.681 target) and $2,245 (A=C).
The Moving Average Convergence Divergence (MACD) momentum indicator has started printing bearish red histogram bars and has crossed below its signal line lending the chart a negative tone.
Until the pattern is confirmed, however, there is still a chance Gold price could rally. A break above the cluster of Moving Averages and the peak of wave B at $2,350 would potentially usher in a new more bullish environment. This could then see a retest of the $2,400 highs.
Additionally, the trend for Gold price is up both in the medium and long-term, overall supporting the outlook for bulls.
Economic Indicator
Employment Cost Index
The Employment Cost Index (ECI), released by US Bureau of Labour Statistics, is a quarterly measure of the change in the price of labor, defined as compensation per employee hour worked. Closely watched by many economists, the ECI is an indicator of cost pressures within companies that could lead to price inflation for finished goods and services. The index measures changes in the cost of compensation not only for wages and salaries, but also for an extensive list of benefits.
Read more.Last release: Tue Apr 30, 2024 12:30
Frequency: Quarterly
Actual: 1.2%
Consensus: 1%
Previous: 0.9%
Source: US Bureau of Labor Statistics
Forex News
Keep up with the financial markets, know what's happening and what is affecting the markets with our latest market updates. Analyze market movers, trends and build your trading strategies accordingly.