USD/CAD Price Analysis: Hovers near 1.3700 within the ascending channel
- USD/CAD could gain ground as technical analysis indicates a recovery of bullish sentiment.
- A break above 1.3800 could lead the pair to revisit its five-month high of 1.3846.
- A breach below the channel’s lower boundary around 1.3630 could weaken the bullish sentiment.
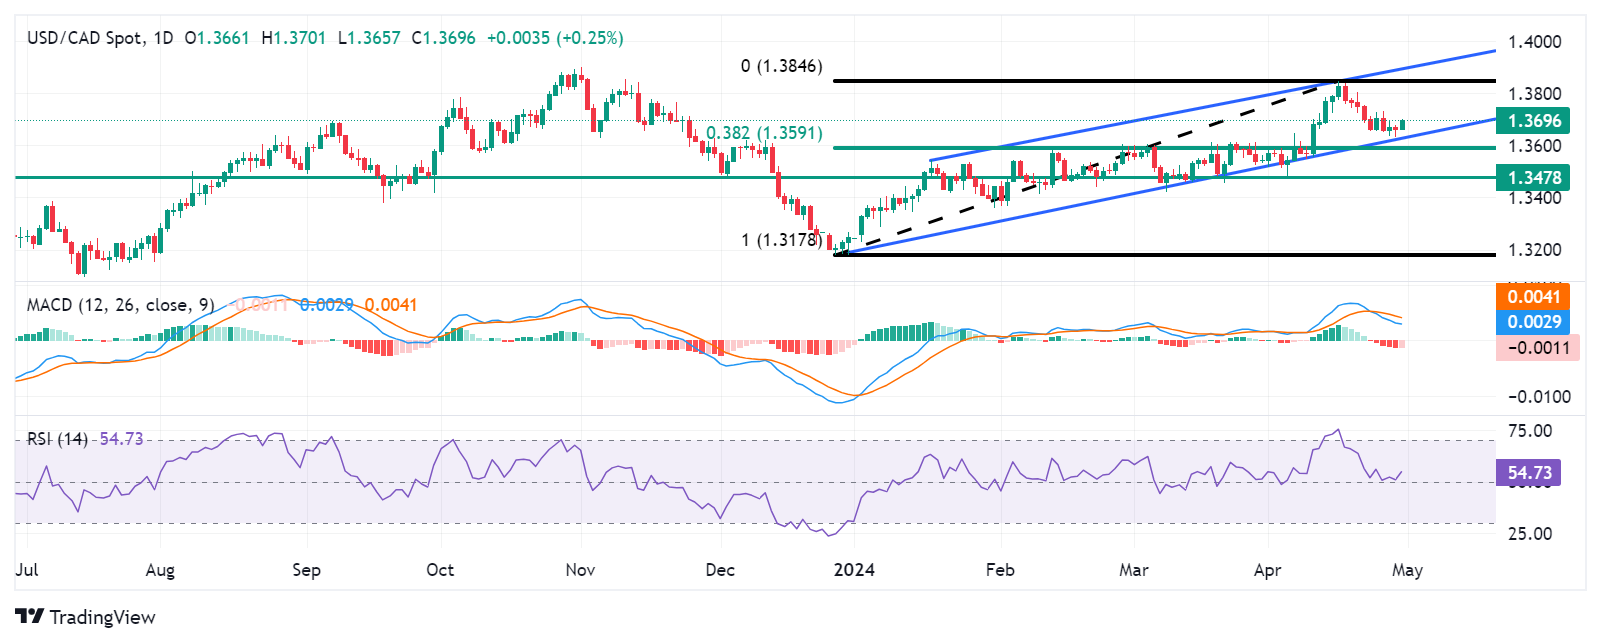
USD/CAD consolidates within the ascending channel on the daily chart, with the 14-day Relative Strength Index (RSI) positioned above 50, indicating a recovery of bullish sentiment. The pair edges higher to near 1.3700 during the European session on Tuesday.
Moreover, the Moving Average Convergence Divergence (MACD) line is above the centerline, signaling bullish momentum, although it remains below the signal line. Traders may look for confirmation from the MACD, a lagging indicator, to ascertain the direction of the trend.
The USD/CAD pair may encounter resistance near the psychological level of 1.3800. A breakthrough above this level could pave the way for the pair to revisit its five-month high of 1.3846, followed by the upper boundary of the ascending channel and the psychological barrier of 1.3900.
On the downside, the USD/CAD pair might test the lower boundary of the channel around the 1.3630 level. A breach below this level could exert downward pressure on the pair, leading it toward the region around the psychological support at 1.3600 and the 38.2% Fibonacci retracement level of 1.3591, plotted between the levels of 1.3178 and 1.3846.
The next significant support level lies at 1.3478, should the USD/CAD pair experience further depreciation, followed by December’s low at 1.3178.
USD/CAD: Daily Chart
Forex News
Keep up with the financial markets, know what's happening and what is affecting the markets with our latest market updates. Analyze market movers, trends and build your trading strategies accordingly.