AUD/JPY Price Analysis: Bulls must regain the 20-day SMA to avoid further losses
- The daily RSI for the AUD/JPY demonstrates a modest uptrend, maintaining above the middle ground.
- The Hourly chart reveals mixed sentiment, with frequent RSI changes and negative momentum portrayed by the MACD bars.
- The 20-day SMA at 99.30 is the main target for the bulls.
The AUD/JPY showed a stronger stance by posting a gain of 0.27% and settling at 99.24 in Wednesday’s session. Despite the recent downside, the pair indicates a dominant bullish outlook, firmly standing above the key Simple Moving Averages (SMAs). However, the recent dip below the 20-day SMA brightened the outlook for the bears for the short term.
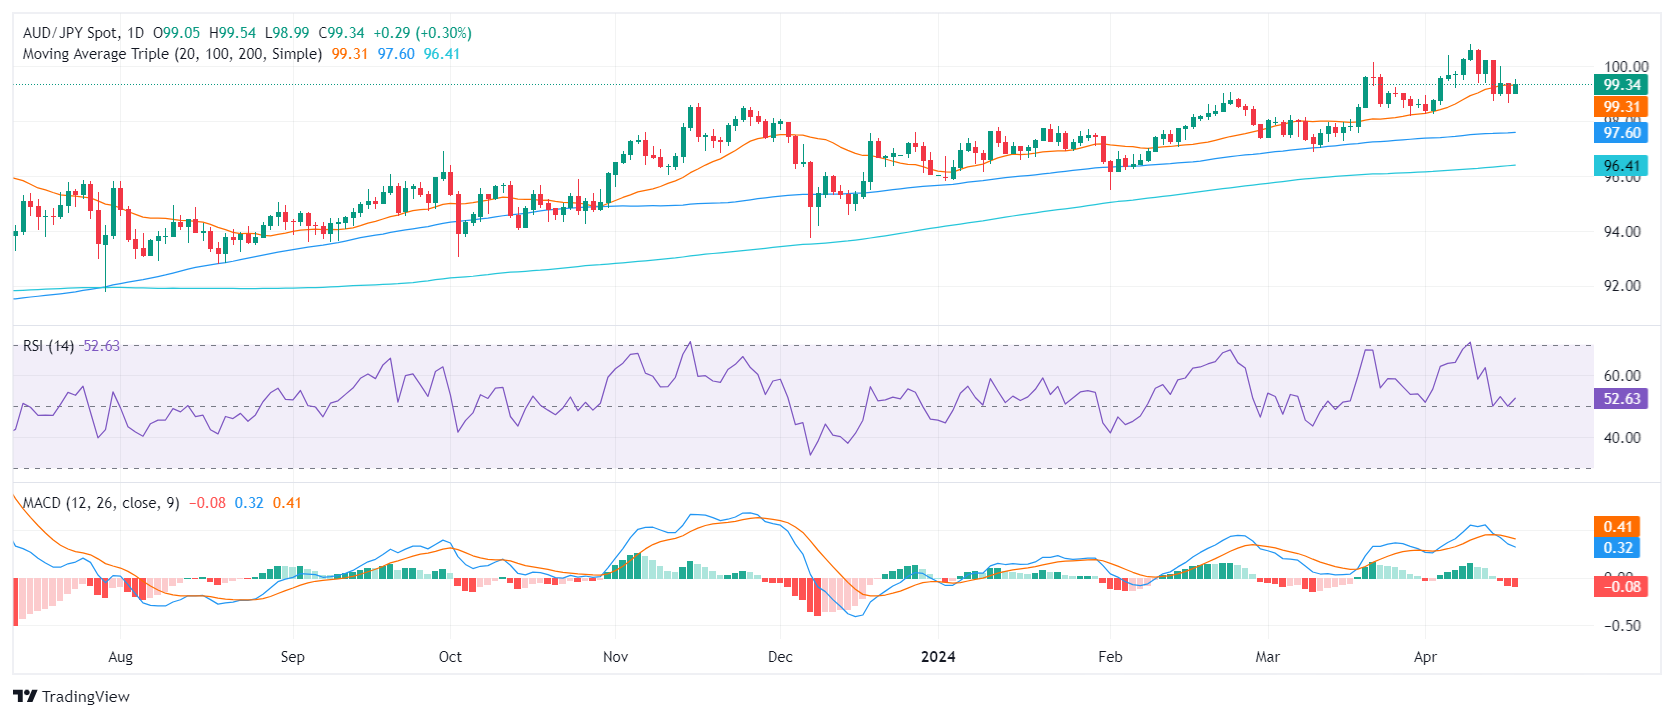
On the daily chart, the Relative Strength Index (RSI) pair indicates a slight positive trend. Despite dipping close to the 50 level, it recovered and retained its position in positive territory, hovering around 52. Meanwhile, the Moving Average Convergence Divergence (MACD) shows rising red bars, signaling a potential shift in momentum.
AUD/JPY daily chart
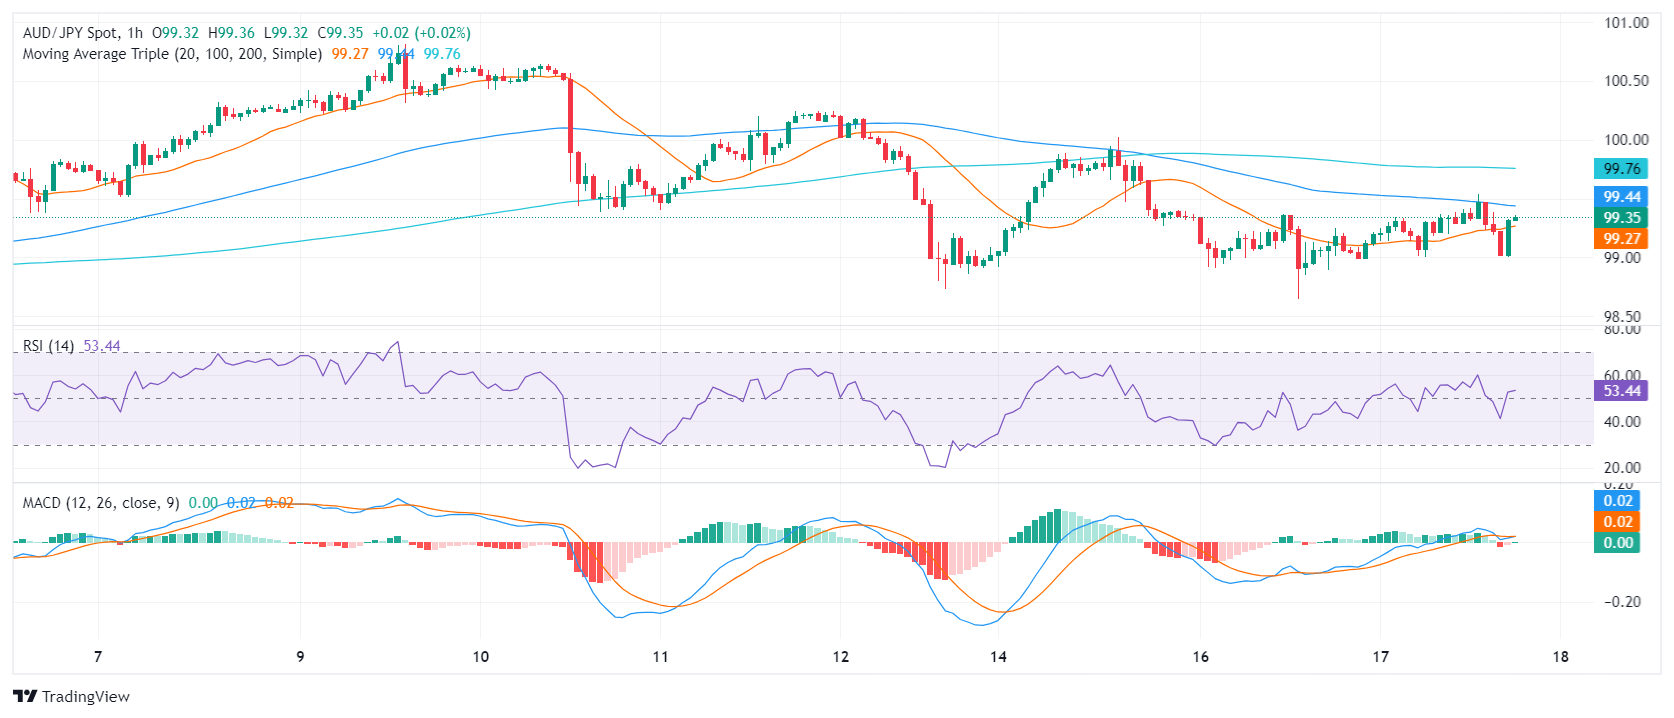
The hourly RSI reveals a mixed trend. The latest reading was 53, indicating a positive trend, while previous readings varied between positive and negative territories, revealing fluctuating market momentum. The hourly MACD shows flat red bars, signifying a steady negative momentum.
AUD/JPY hourly chart
Observing the broader prospect, the AUD/JPY's position above the 100-day and 200-day SMA reveals a robust long-term bullish trend. Any significant movements today that keep the cross above these levels won’t threaten the positive outlook, but as the bears gather momentum, some downside in the short term should be expected.
Forex News
Keep up with the financial markets, know what's happening and what is affecting the markets with our latest market updates. Analyze market movers, trends and build your trading strategies accordingly.