Silver Price Analysis: XAG/USD plunges over 3%, back beneath $27.00
- Silver drops to $26.29 amid a strengthening US Dollar and rising Treasury yields, influenced by higher employment costs.
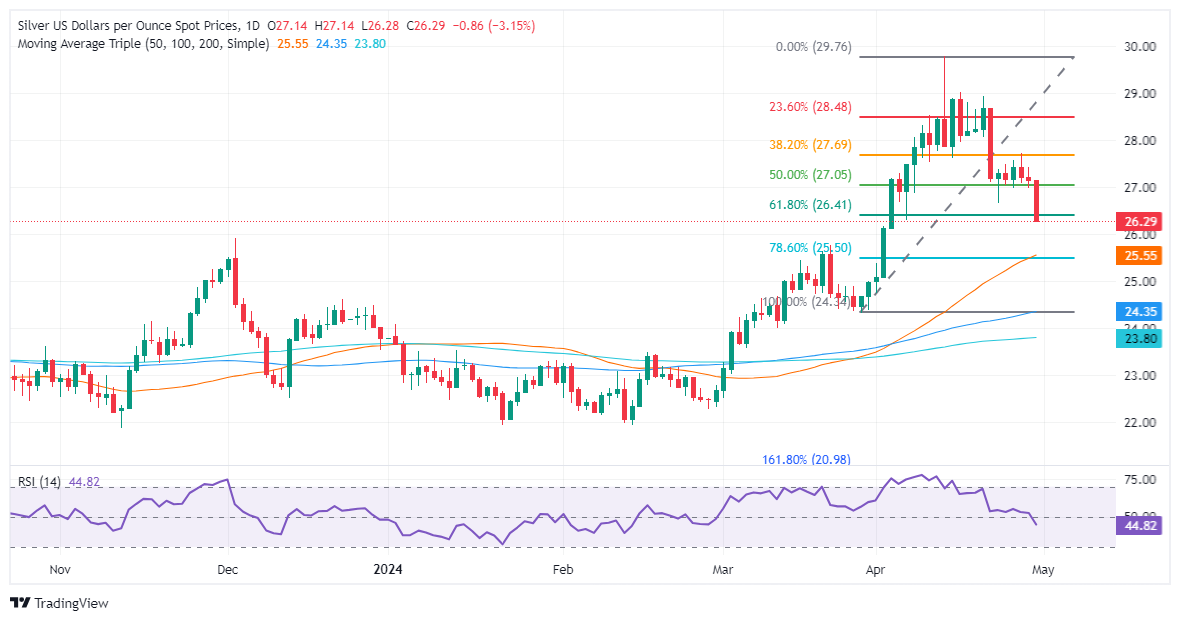
- Technical support is identified near $26.12, the high from May 5, 2023. Additional support might be found around the 78.6% Fibonacci retracement and the 50-day moving average at approximately $25.50/57.
- A rebound above $27.00 could set the stage for silver to target the recent high of $27.73 and challenge the $28.00 resistance level.
Silver's price dropped sharply late in the North American session, as the Greenback staged a comeback bolstered by the rise in US Treasury yields. The rise in the US Employment Cost Index (ECI) reignited talks that the Federal Reserve might delay its rate cuts due to inflation pressures. The XAG/USD trades at $26.29, down more than 3%.
XAG/USD Price Analysis: Technical outlook
The daily chart suggests the grey metal is upward biased despite Silver’s fall, which would likely see support emerging at $26.12, May 5, 2023, high. A breach of the latter will expose the confluence of the 78.6% Fibonacci retracement and the 50-day moving average (DMA) at around $25.50/57.
Otherwise, if XAG/USD recovers and edges back above the $27.00 figure, that could open the door to retesting higher prices. Subsequent gains are seen above the April 26 high at $27.73, followed by the $28.00 figure.
XAG/USD Price Action – Daily Chart
Forex News
Keep up with the financial markets, know what's happening and what is affecting the markets with our latest market updates. Analyze market movers, trends and build your trading strategies accordingly.