Silver Price Forecast: XAG/USD falls after early gains from $29, near-term outlook remains firm
- Silver price retreats from day’s high amid no signs of retaliation from Iran after limited airstrike from Israel.
- Fed’s hawkish guidance fails to prompt US bond yields.
- Fed Williams is comfortable with more rate hikes if inflation remains persistent.
Silver price (XAG/USD) falls back while attempting to recapture crucial resistance of $29.00 in Friday’s European session. The white metal surrenders early gains, prompted by reports from the Middle East that Iran’s air defence destroyed three drones by the Israeli army. Israel has not yet confirmed that they made those attacks in retaliation to an airstrike by Iran on their state.
The near-term outlook for Silver remains firm as worsening geopolitical tensions will keep the safe-haven demand intact. Meanwhile, global markets exhibit an asset-specific action as risk-perceived currencies have recovered losses reported in early Asia, while global equites remain under pressure. S&P 500 futures have posted significant losses in the European session.
Yields on interest-bearing assets from the United States economy have plummeted despite the Federal Reserve (Fed) lean towards keeping interest rates higher for a longer period. 10-year US Treasury yields fall to 4.59%. A decline in bond yields diminish the opportunity cost of investment in bullions.
On Thursday, New York Fed President John Williams said he doesn't see urgency for rate cuts and warned that the central bank is ready to hike again if data suggests persistent price pressures.
The US Dollar Index (DXY) holds the 106.00 ground as Fed policymakers support keeping interest rates higher due to stubbornly high inflation, which has been fed by tight labor market conditions.
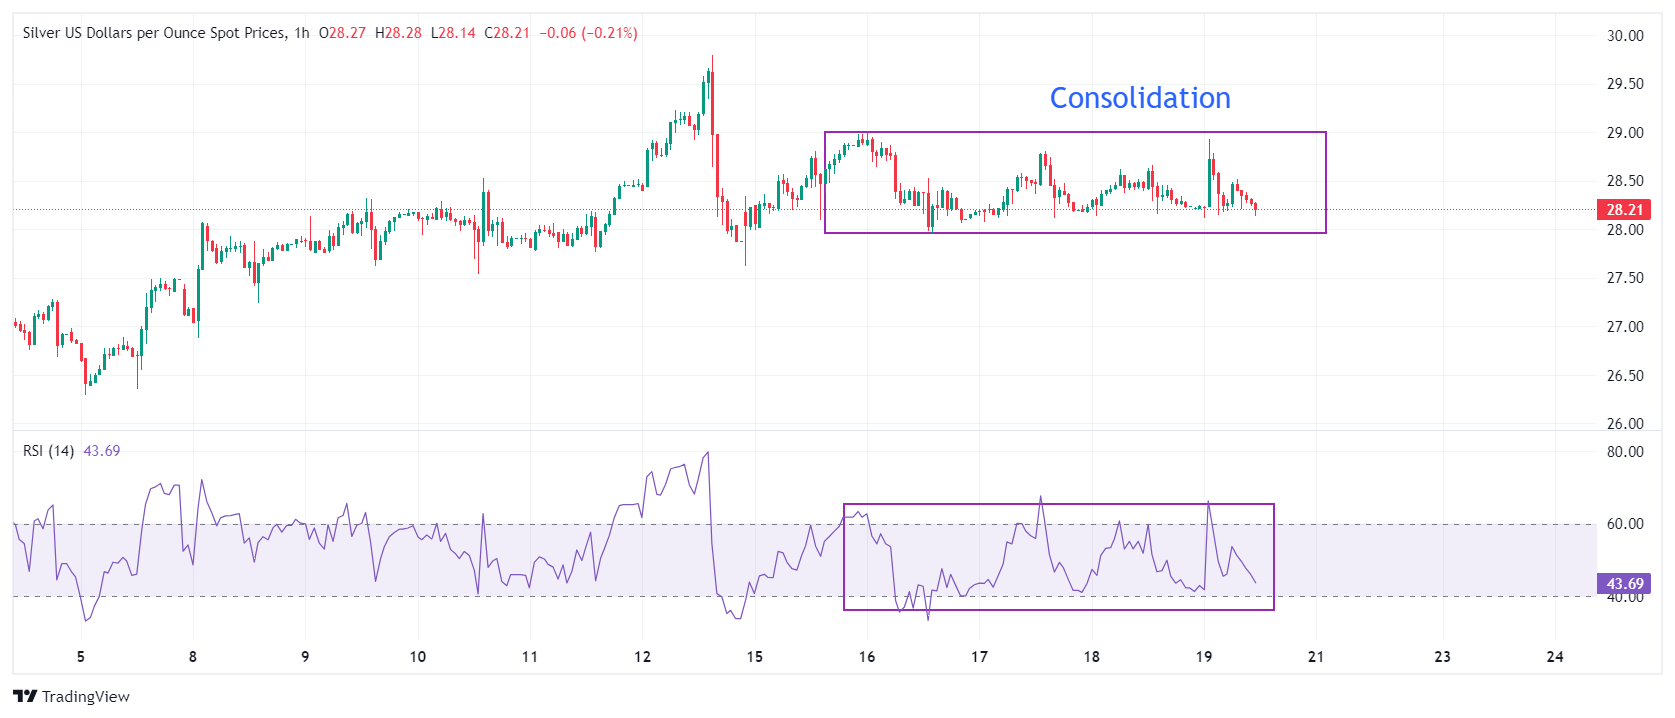
Silver technical analysis
Silver price remains in a tight range between $28 and $29 from last four trading sessions on an hourly timeframe. This demonstrates a sharp volatility contraction, which could explode in either direction. The 14-period Relative Strength Index (RSI) oscillates inside the 40.00-60.00 range, indicating indecisiveness among market participants.
Silver hourly chart
Forex News
Keep up with the financial markets, know what's happening and what is affecting the markets with our latest market updates. Analyze market movers, trends and build your trading strategies accordingly.