Gold battling around 1800 psychological level
After falling to 1780, gold buyers managed to recover some losses with a rebound to 50- and 200-day exponential moving averages. However, a solid bearish mindset formed a shooting star candlestick yesterday, signaling rejection of higher prices at the psychological threshold of $1800. Still, a crossing below Tuesday's low of 1795.50 is required to confirm the short-term reversal.
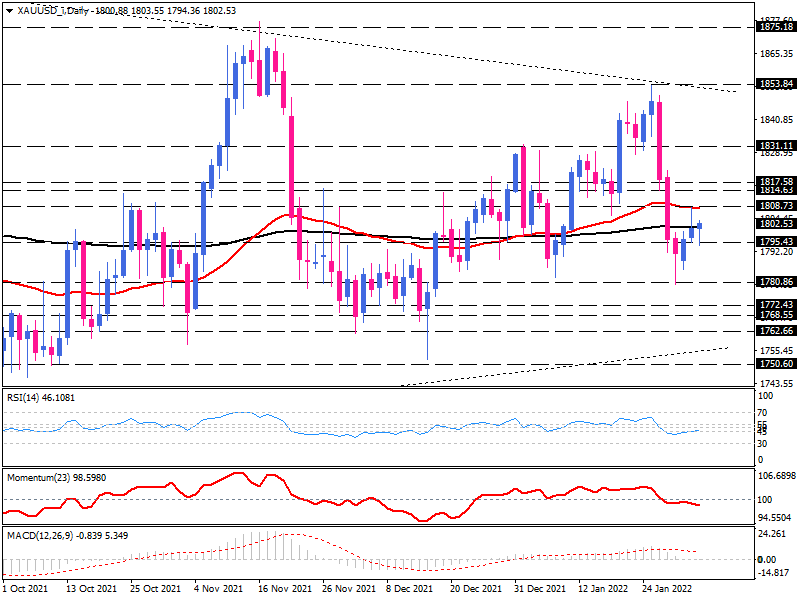
Momentum oscillators, meanwhile, show a surge in selling sentiment. RSI and Momentum have dropped into the selling area after a month. The MACD bar also gives a bearish signal by crossing below the zero line.
Gold on the four-hour chart
On the four-hour chart, it appears that moving averages have served as a severe resistance level. Selling intention is challenged by the $1795.50 obstacle. If the selling forces succeed in breaking this support level, then 1780 becomes the next focus. Defeating this barrier could extend the price drop to 1772 and 1768. Sellers must get past 1762 support before reaching the bottom of the triangle pattern.
Alternatively, if 1795.50 support remains in place, buyers might push prices up to the previous level of interest at $ 1808, near EMAs wall of resistance. If the market crosses this important resistance area, more buyers will come on board to keep the market climbing. Prevailing bullish Momentum would then put 1814 and 1817 on the radar.
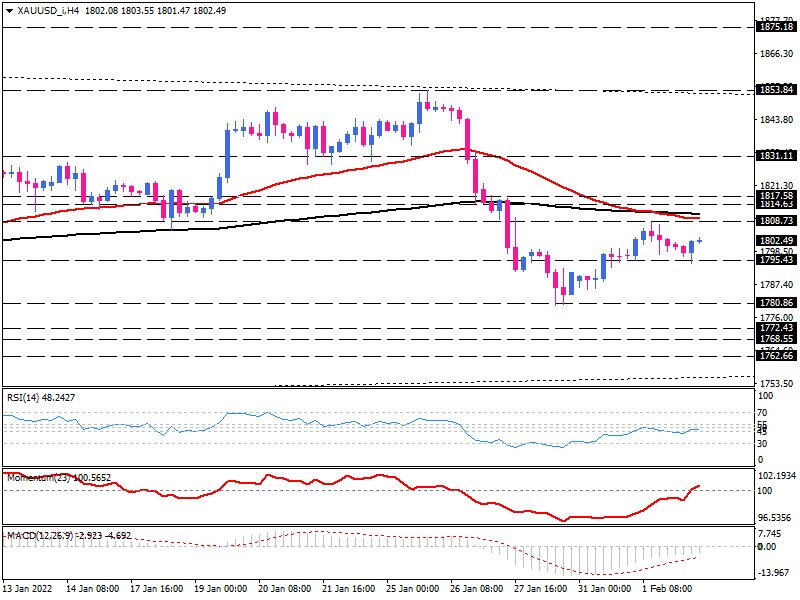
Momentum oscillators convey a mixed picture here. RSI is moving in the neutral zone, and the Momentum is challenging with the 100-baseline. While the run of successive negative MACD bars towards zero signals the fading of selling pressure in the short term.