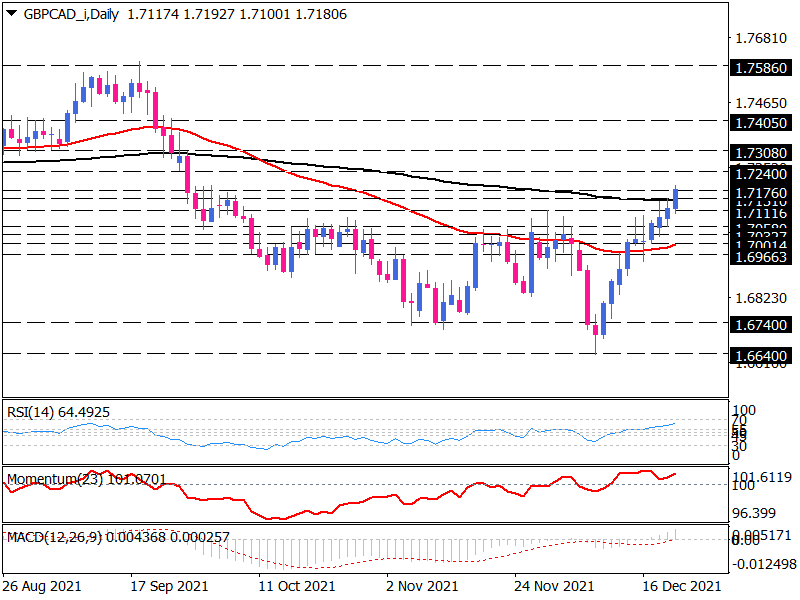
GBP/CAD rally continues at the 200-day EMA
GBP/CAD has been trading upward on the daily chart, recovering from an 18-month low around the 1.6640 handles. The recent break above two-month highs at the 1.7111 mark has completed a bullish reversal called double-bottom pattern. Currently, buyers are struggling with the 200-day EMA. If they overstep this significant barrier, GBP/CAD will find a chance to keep rallying up. In that case, the following resistance would be seen around the 1.7240 barrier. At the same time, the eventual target of the pattern can be projected at the 1.7586 mark.
Oscillators suggest the bullish momentum is prevailing as the RSI is pointing north in the buying territory, and momentum is trending upward above its 100-baseline. It is not just the MACD bars that stay in the positive region, but also the signal line is about to cross above zero.
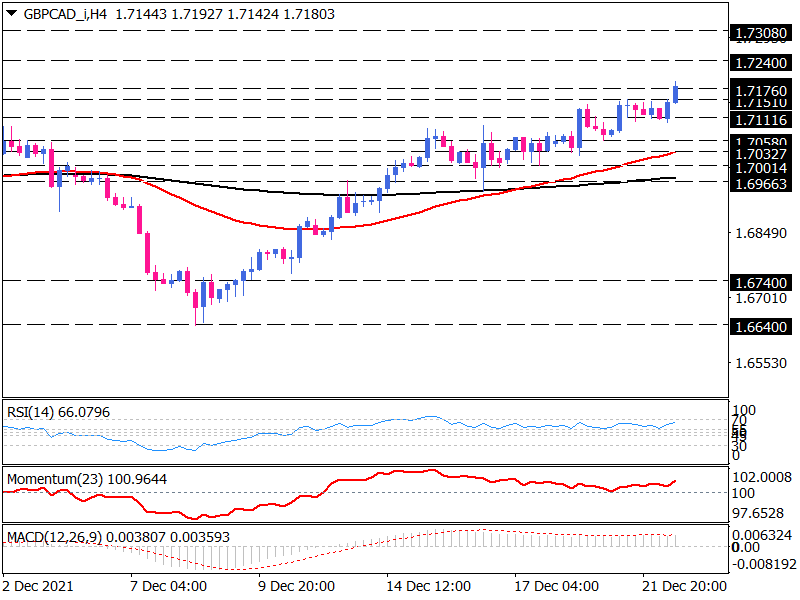
Mid-term technical view
The pair is trading above the 50 and 200 exponential moving averages on the four-hour chart, between the 1.7058 swing bottom and 1.7151 swing top. The EMAs’ crossover reflects the increasing bullish bias in the market.
If the bulls cut down the 1.7151 hurdles, the next resistance may commence from the 1.7176 mark. Overcoming this step can push the price higher towards the 1.7240 and 1.7308 barriers, respectively.
On the flip side, if bearish momentum intensifies, GBP/CAD may find support around the 1.7058-mark. With a break below this edge, sellers would target 1.7033 in the vicinity of the 50-EMA. The further decline will have them to eye 1.6965 in the smack of 200-EMA.
Momentum oscillators convey bullish bias as the RSI ranges above 50-level in buying territory, and the momentum is falling towards the 100-base line. The MACD bars stay along the signal line in the positive region.