A bullish reversal in XAU/USD ahead of US inflation data
On Wednesday, gold formed a reverse head and shoulders pattern on its 4-hour chart after making a higher bottom at the 1772-mark.
It is no surprise that market sentiment remains positive mid-week, supporting gold prices to fresh weekly highs above $1,790 in the wake of the weakening dollar. Even though the U.S. dollar index remains above 96, the falling yields drove up interest in gold ahead of the U.S. inflation report.
Since the beginning of this week, optimism regarding the less severe effects of the Omicron covid variant has continued to undermine the safe-haven U.S. dollar. The U.S. inflation data due on Friday is expected to drive trading activities.
Technical outlook
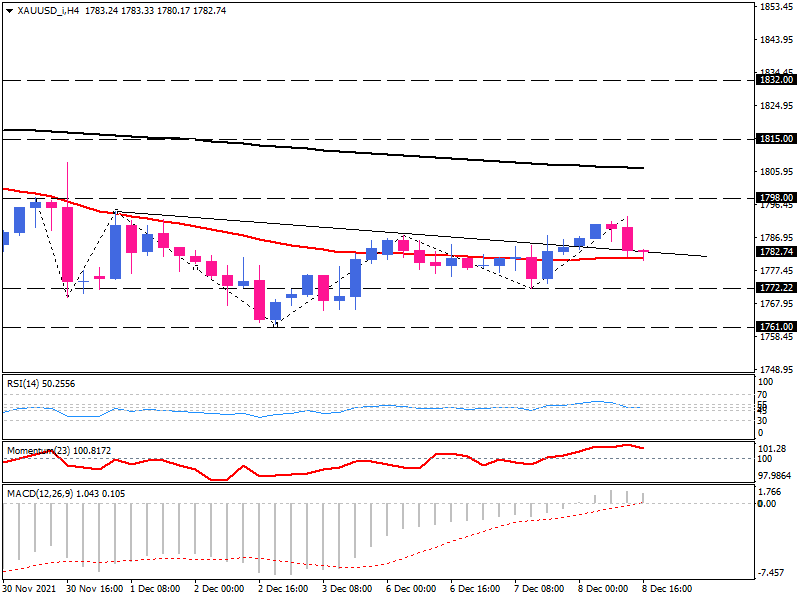
On the 4-hour chart, gold has formed a reverse head and shoulders pattern after making a higher bottom at the 1772-mark. Sellers are trying to run a move following the 1793 peak. However, as long as bulls continue to hold the neckline, they hope to reach the 1798-obstacle, which is just below the 200-EMA resistance level.
In the case that the price makes a fresh high above this level, then buyers might target the 1815-barrier.
Oscillators indicate downside momentum is weakening as the RSI is pulling up in the neutral zone, and the momentum is hovering above the 100-threshold. Likewise, the MACD histogram is progressing in the positive region, and the signal line is about to cross above the zero line.
Conversely, the price will likely plunge towards the 1772-barrier at the right shoulder if downside forces intensify. A decisive break of this area can invalidate the bullish reversal pattern.