
Japanese Yen drops to fresh daily low; USD/JPY approaches 155.00 ahead of US PMIs
- The Japanese Yen struggles to capitalize on stronger domestic inflation-inspired intraday uptick.
- The BoJ rate-hike uncertainty, the upbeat market mood and elevated US bond yields cap the JPY.
- The USD climbs to a fresh year-to-date high and offers additional support to the USD/JPY pair.
The Japanese Yen (JPY) attracts fresh sellers following an intraday uptick led by stronger domestic consumer inflation figures amid expectations that increased political uncertainty could delay the Bank of Japan's (BoJ) rate-hike plan. Moreover, elevated US Treasury bond yields, bolstered by expectations that US President Donald Trump's policies could boost inflation and force the Federal Reserve (Fed) to cut rates slowly, is seen weighing on the lower-yielding JPY.
Adding to this, the prevalent risk-on environment is seen as another factor denting demand for the safe-haven JPY. This, along with sustained US Dollar (USD) buying interest, contributes to the USD/JPY pair's goodish intraday bounce of over 80 pips from sub-154.00 levels. That said, fears that Japanese authorities might intervene in the FX market to prop up the domestic currency might hold back the JPY bears from placing aggressive bets and cap the currency pair.
Japanese Yen turns lower after a short-lived Japanese CPI-led uptick
- The Japan Statistics Bureau reported this Friday that the National Consumer Price Index (CPI) eased from 2.5% to the 2.3% YoY rate in October, while the core CPI, which excludes volatile fresh food items, grew 2.3%.
- Additional details revealed that a core inflation reading that excludes both energy and fresh food costs remained above the Bank of Japan's 2% annual target and rose to 2.3% in October from 2.1% in the prior month.
- The Bank of Japan Governor Kazuo Ueda said on Thursday that the central bank will seriously take into account the impact the recent foreign exchange-rate movements could have on the economic and price outlook.
- This keeps the door open for another BoJ interest rate-hike move in December, which, along with geopolitical risks from the worsening Russia-Ukraine war, boosts the Japanese Yen during the Asian session on Friday.
- Meanwhile, US data released on Thursday showed that Weekly initial jobless claims dropped by 6,000 to 213,000, or a seven-month low last week as compared to consensus estimates for a reading of 220,000.
- US Existing Home Sales rebounded sharply after September's slump to the lowest since October 2010 and rose to an annual rate of 3.96 million units in October, posting the first annual gain since mid-2021.
- A survey showed that manufacturing activity in the Philadelphia region unexpectedly contracted in November. The Federal Reserve (Fed) Bank of Philadelphia's Manufacturing Index dropped to -5.5 from +10.3.
- Chicago Fed President Austan Goolsbee said that the inflation is on its way down to 2% and that it may make sense to slow the pace of interest rate cuts as the US central bank gets close to where rates will settle.
- Separately, New York Fed President John Williams noted that he sees inflation cooling and interest rates falling further as the labor market is now in balance and not providing any upward pressure on inflation.
- The US Dollar shot to its highest level since October 4, 2023, amid expectations that US President-elect Donald Trump's policies could reignite inflation and limit the scope for the Fed to cut interest rates further.
- Furthermore, persistent concerns about inflation and potential fiscal expansion keep the US Treasury bond yields elevated, which, along with the upbeat market mood, caps the upside for the safe-haven JPY.
- Traders now look forward to the release of the flash US Manufacturing and Services PMI prints, and the revised Michigan Consumer Sentiment Index for short-term opportunities heading into the weekend.
USD/JPY repeated bounces from the 100-period SMA on H4 favor bulls
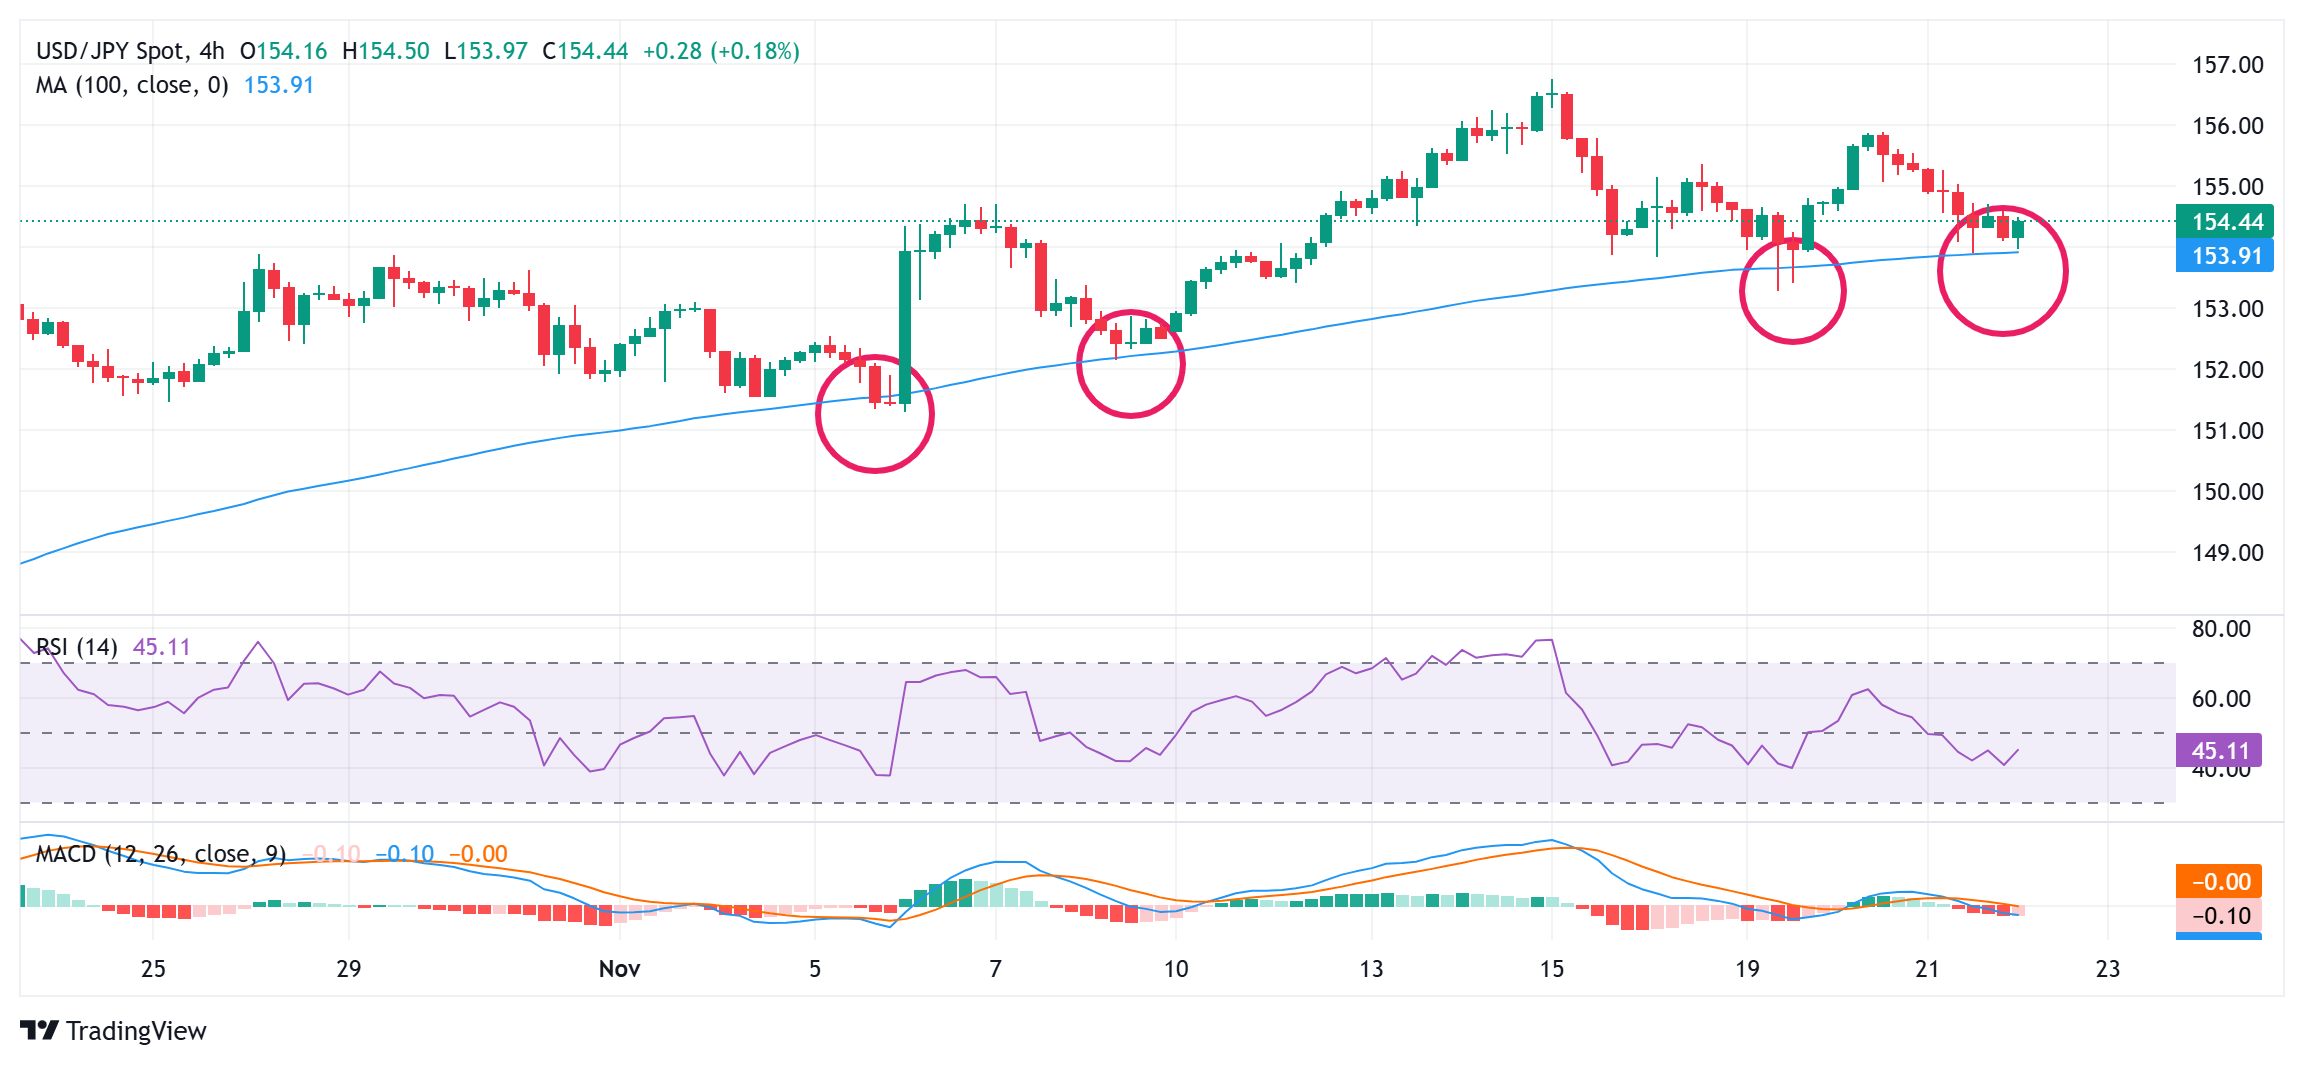
From a technical perspective, the USD/JPY pair has been showing some resilience below the 154.00 mark, which now coincides with the 100-period Simple Moving Average (SMA) on the 4-hour chart. Adding to this, oscillators on the daily chart are holding in positive territory, suggesting that any subsequent slide towards the 153.30-153.25 area, or the weekly low, could be seen as a buying opportunity.
Some follow-through selling below the 153.00 mark, however, could drag the USD/JPY pair to the next relevant support near mid-152.00s en route to the 152.00 round figure. The said handle coincides with the 200-day Simple Moving Average (SMA) and should act as a key pivotal point for short-term traders.
On the flip side, immediate support is pegged near the 155.00 psychological mark, above which the USD/JPY pair could climb to the 155.40 supply zone. A sustained strength beyond the latter could lift spot prices beyond the 156.00 round figure, towards the 156.25-156.30 intermediate hurdle en route to the multi-month peak, around the 156.75 region touched last week.
Economic Indicator
S&P Global Composite PMI
The S&P Global Composite Purchasing Managers Index (PMI), released on a monthly basis, is a leading indicator gauging US private-business activity in the manufacturing and services sector. The data is derived from surveys to senior executives. Each response is weighted according to the size of the company and its contribution to total manufacturing or services output accounted for by the sub-sector to which that company belongs. Survey responses reflect the change, if any, in the current month compared to the previous month and can anticipate changing trends in official data series such as Gross Domestic Product (GDP), industrial production, employment and inflation. The index varies between 0 and 100, with levels of 50.0 signaling no change over the previous month. A reading above 50 indicates that the private economy is generally expanding, a bullish sign for the US Dollar (USD). Meanwhile, a reading below 50 signals that activity is generally declining, which is seen as bearish for USD.
Read more.Next release: Fri Nov 22, 2024 14:45 (Prel)
Frequency: Monthly
Consensus: -
Previous: 54.1
Source: S&P Global
Forex News
Keep up with the financial markets, know what's happening and what is affecting the markets with our latest market updates. Analyze market movers, trends and build your trading strategies accordingly.