
GBP/CAD Price Prediction: Bearish Shooting Star candlestick at top of rising channel
- GBP/CAD has formed a bearish candlestick pattern after briefly breaking above a channel line.
- This could be a sign a pullback is about to unfold, however, downside pressure has been limited so far.
GBP/CAD has temporarily broken above the upper channel line of a long-term rising channel before falling back down and closing (on Friday) near where it opened.
The pattern thus formed is a Japanese Shooting Star candlestick (orange rectangle on chart below) which is a short-term bearish sign, especially if followed up by a bearish down day, as seems to be the case (so far) on Monday.
GBP/CAD Daily Chart
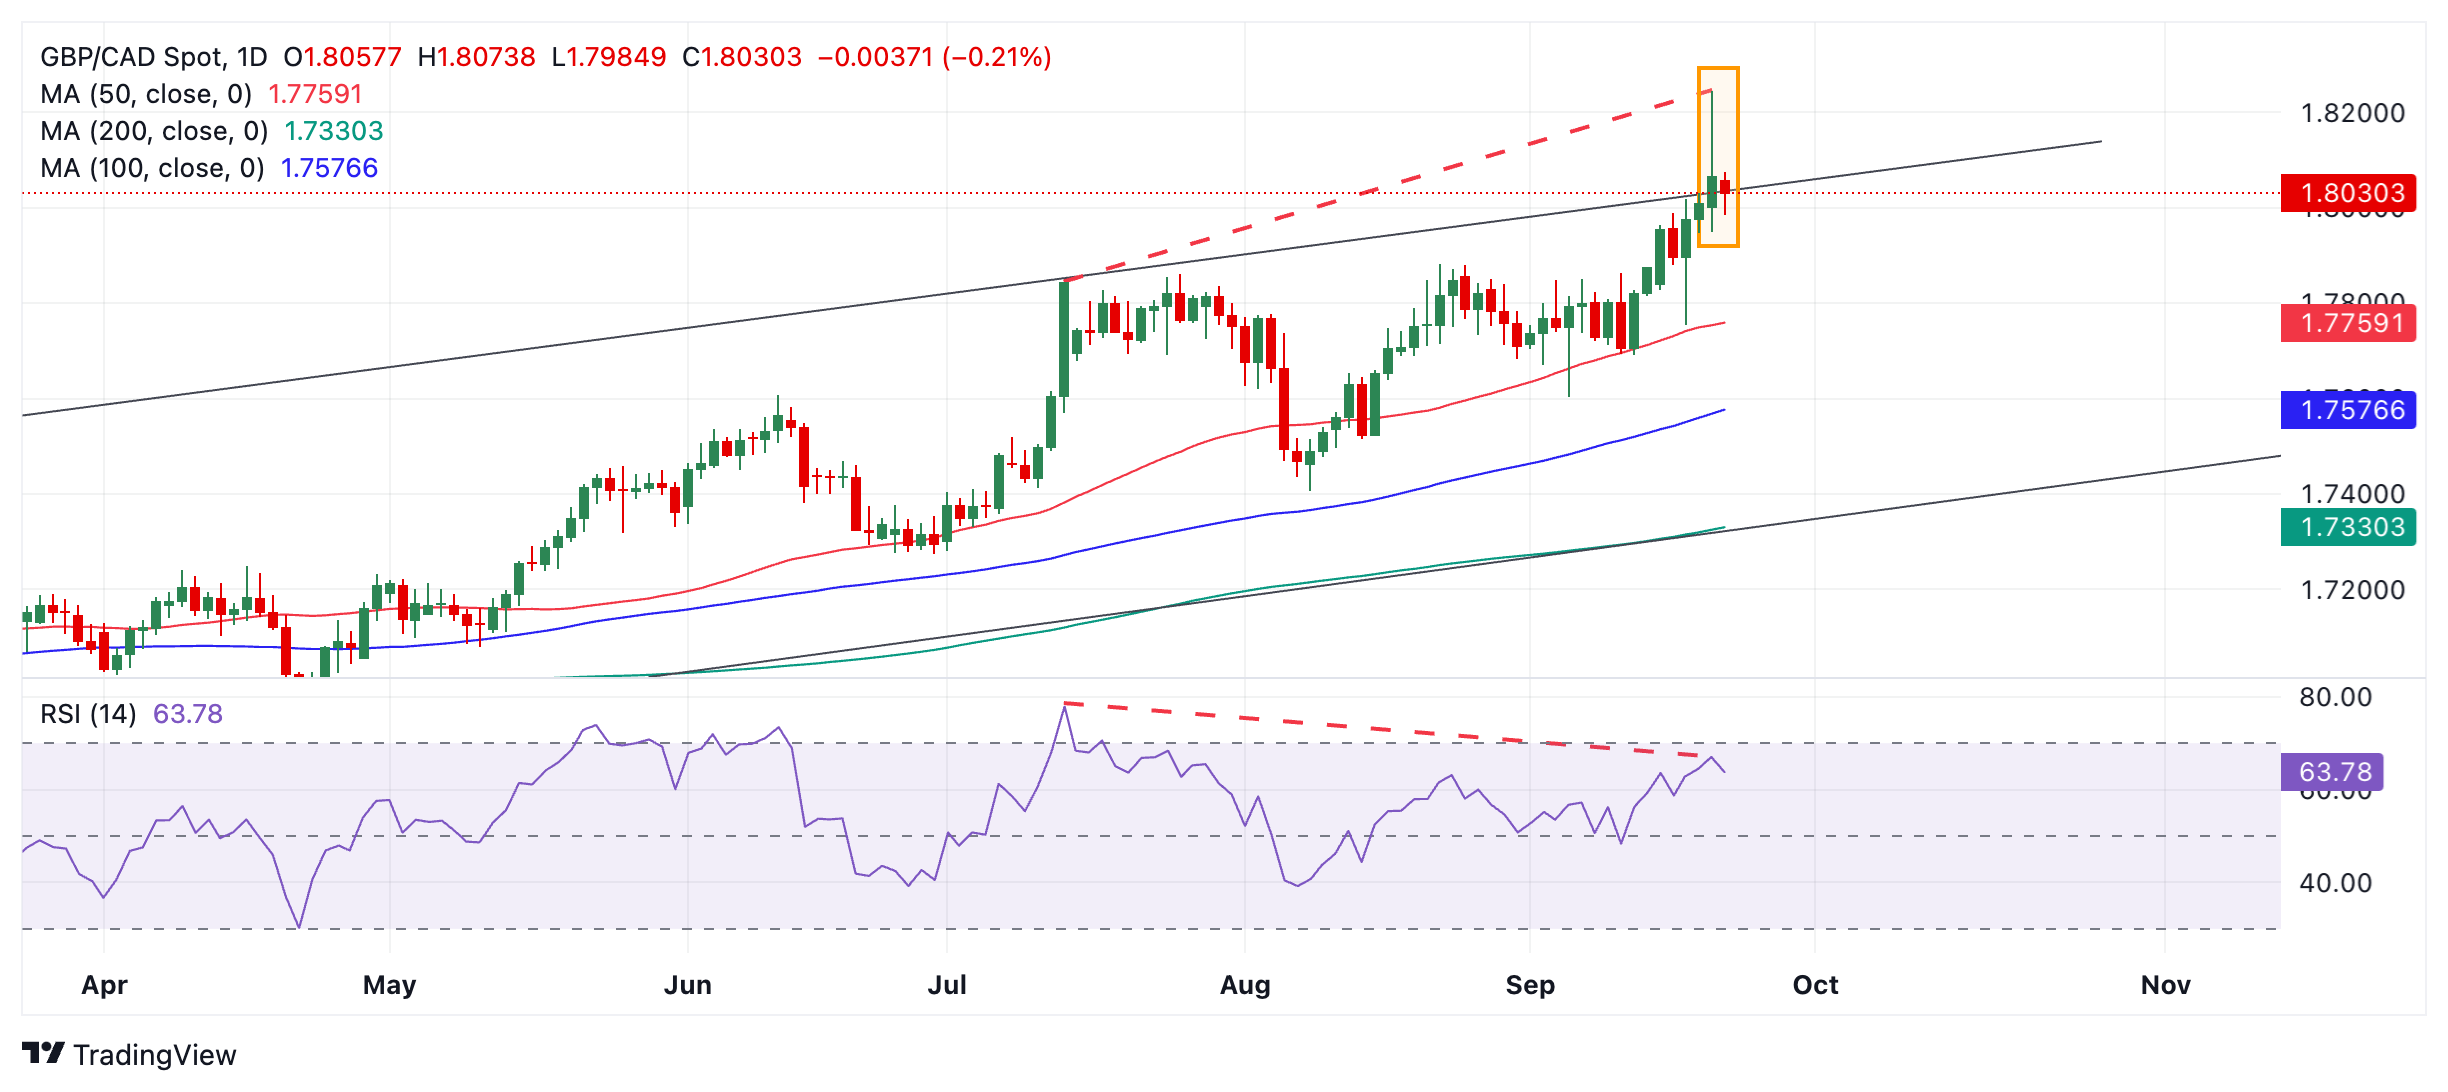
That said, GBP/CAD is in an uptrend on all three major time frames – the short, medium and long-term. This suggests that overall the “current” is flowing north. Given it is a principle of technical analysis that “the trend is your friend” this would suggest the odds continue to favor more upside.
However, GBP/CAD is also showing bearish divergence with the Moving Average Convergence Divergence (MACD) momentum indicator (red dashed lines). Although the price has risen to a much higher peak compared to July 12, the MACD is actually lower. This is a bearish sign and suggests a higher chance of a pull back evolving. Given the strong overarching uptrend, however, the pullback might just be a temporary sell-off.
If there is a correction, however, it might reach the 50-day Simple Moving Average (SMA) at 1.7753.
Alternatively, a break above the high of the Shooting Star at 1.8245 would probably confirm that price is going even higher. If so, it might reach a target at 1.8278, the 61.8% extrapolation of the prior move higher.
Any further bullishness beyond the confines of the channel is likely to be short-lived. Such moves often signal “exhaustion” and are a precursor to deeper corrections on the horizon.
Forex News
Keep up with the financial markets, know what's happening and what is affecting the markets with our latest market updates. Analyze market movers, trends and build your trading strategies accordingly.