
Japanese Yen advances to multi-day peak against USD as geopolitical risks boost safe-haven assets
- The Japanese Yen reverses an intraday dip amid sustained demand for traditional safe-haven assets.
- The divergent BoJ-Fed expectations turn out to be another factor underpinning the lower-yielding JPY.
- The USD/JPY bears look forward to the crucial Fed decision on Wednesday before placing fresh bets.
The Japanese Yen (JPY) attracts fresh buyers following an intraday dip and turns higher against its American counterpart for the third successive day on Tuesday amid a combination of supporting factors. With the latest leg down, the JPY has now reversed its losses, led by the Bank of Japan's (BoJ) dovish pause last Thursday. Moreover, a combination of supporting factors suggests that the path of last resistance for the JPY remains to the upside.
Investors seem convinced that the BoJ will hike interest rates again in 2025. Furthermore, concerns that US President Donald Trump's rapidly shifting trade policies could impact global economic growth, along with rising geopolitical risks, validate the near-term positive outlook for the safe-haven JPY. On the other hand, the US Dollar (USD) remains depressed ahead of the crucial FOMC meeting, which further contributes to the USD/JPY pair's downfall.
Japanese Yen bulls regain short-term control amid sustained safe-haven demand
- The Bank of Japan struck a cautious tone last week by slashing its growth and inflation forecasts, forcing investors to scale back their bets for the next rate hike in June or July. The central bank, however, reiterated that it remains committed to raising rates further if the economy and prices move in line with its forecasts.
- US President Donald Trump's erratic trade policies overshadow the optimism led by signs of easing US-China trade tensions and keep investors on edge. In fact, Trump on Sunday announced a 100% tariff on all movies produced in foreign countries. Moreover, geopolitical risks lend support to the safe-haven Japanese Yen.
- Russia's defense ministry said that Ukraine launched a drone attack targeting Moscow for the second night in a row on Monday. This follows reports of fresh attempts by Ukraine to cross into Russia's Kursk region. This comes days after Russian President Vladimir Putin declared a three-day ceasefire over May 8-10.
- Adding to this, Israel struck targets in Yemen in response to the Iranian-backed Houthis' ballistic missile attack that hit Israel’s main airport on Sunday. The Houthis warned on Sunday that they could strike again and would impose a comprehensive air blockade on Israel by repeatedly targeting airports.
- Meanwhile, Trump hinted at possible trade agreements with certain countries as early as this week and also signaled that he is open to lowering massive tariffs imposed on China. Furthermore, China's Commerce Ministry said last Friday that it was evaluating the possibility of trade talks with the US.
- On the economic data front, the Institute for Supply Management (ISM) survey showed on Monday that the growth in the US services sector picked up in April. Adding to this, signs of a still resilient US labor market help ease concerns about a US recession and act as a tailwind for the US Dollar.
- Traders, however, seem reluctant to place aggressive bets and opt to move to the sidelines ahead of a two-day FOMC policy meeting starting this Tuesday. Investors will look for fresh cues about the Fed's future interest rate-cut path, which, in turn, will influence the USD and the USD/JPY pair.
USD/JPY seems vulnerable to slide further; intraday breakdown below 143.00 in play
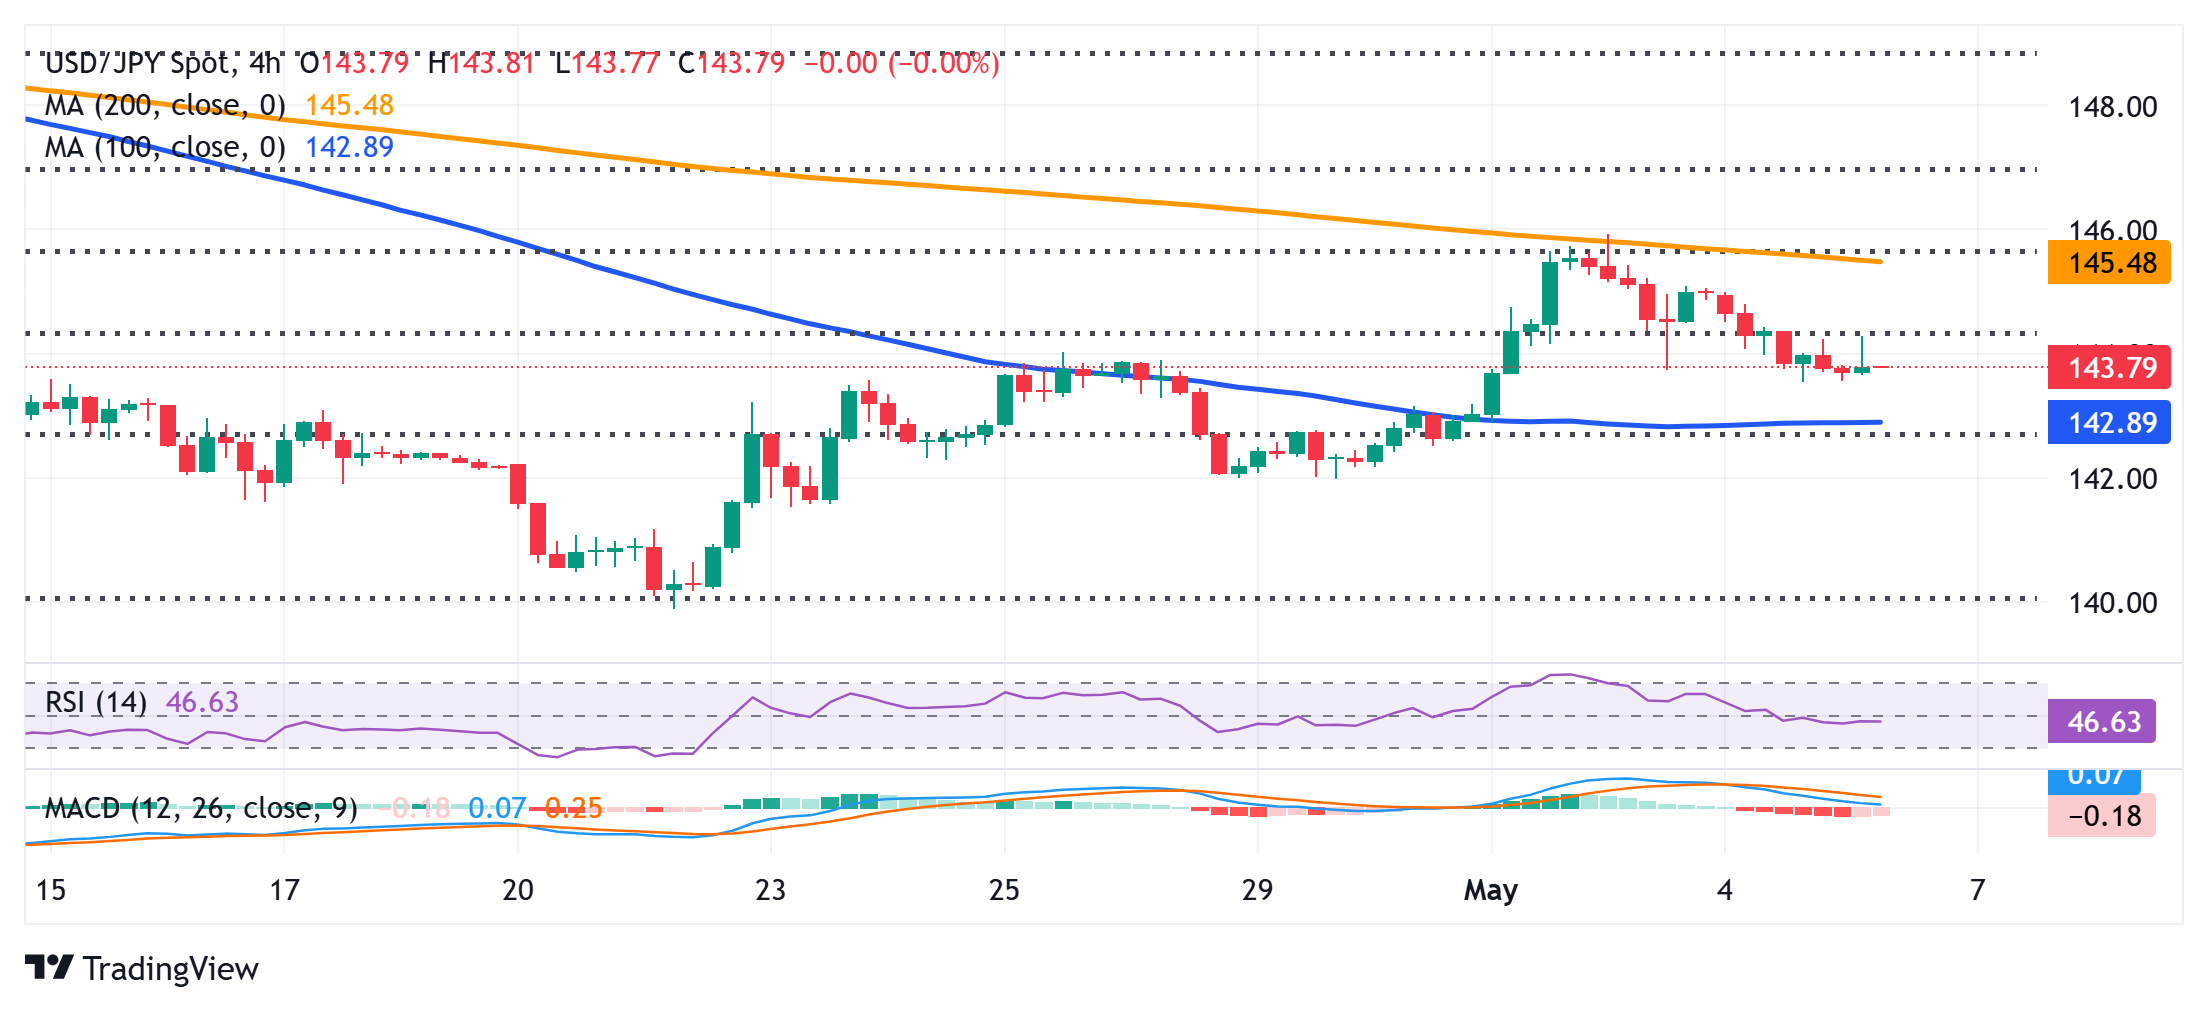
From a technical perspective, the USD/JPY pair last week struggled to find acceptance above the 50% Fibonacci retracement level of the March-April downfall and faced rejection near the 200-period Simple Moving Average (SMA) on the 4-hour chart. The subsequent decline and negative oscillators on daily/hourly charts suggest that the path of least resistance for spot prices is to the downside. Hence, any attempted recovery back above the 144.00 mark might still be seen as a selling opportunity near the 144.25-144.30 supply zone. A sustained strength beyond the latter, however, could trigger a short-covering rally and allow spot prices to reclaim the 145.00 psychological mark.
On the flip side, weakness below the Asian session low, around the 143.55-143.50 area, has the potential to drag the USD/JPY pair to the 143.30 intermediate support en route to the 143.00 mark. The next relevant support is pegged near the 142.65 region, which if broken decisively would expose the 142.00 level before the currency pair eventually drops to the 141.60-141.55 zone and the 141.00 round figure.
US Dollar PRICE Today
The table below shows the percentage change of US Dollar (USD) against listed major currencies today. US Dollar was the strongest against the Australian Dollar.
| USD | EUR | GBP | JPY | CAD | AUD | NZD | CHF | |
|---|---|---|---|---|---|---|---|---|
| USD | -0.19% | -0.21% | -0.51% | -0.05% | 0.19% | -0.30% | 0.12% | |
| EUR | 0.19% | -0.03% | -0.32% | 0.13% | 0.37% | -0.11% | 0.31% | |
| GBP | 0.21% | 0.03% | -0.30% | 0.16% | 0.42% | -0.08% | 0.36% | |
| JPY | 0.51% | 0.32% | 0.30% | 0.45% | 0.70% | 0.30% | 0.65% | |
| CAD | 0.05% | -0.13% | -0.16% | -0.45% | 0.24% | -0.24% | 0.20% | |
| AUD | -0.19% | -0.37% | -0.42% | -0.70% | -0.24% | -0.47% | -0.04% | |
| NZD | 0.30% | 0.11% | 0.08% | -0.30% | 0.24% | 0.47% | 0.44% | |
| CHF | -0.12% | -0.31% | -0.36% | -0.65% | -0.20% | 0.04% | -0.44% |
The heat map shows percentage changes of major currencies against each other. The base currency is picked from the left column, while the quote currency is picked from the top row. For example, if you pick the US Dollar from the left column and move along the horizontal line to the Japanese Yen, the percentage change displayed in the box will represent USD (base)/JPY (quote).
Forex News
Keep up with the financial markets, know what's happening and what is affecting the markets with our latest market updates. Analyze market movers, trends and build your trading strategies accordingly.