Australian Dollar holds steady despite risk-off mood, US Q4 GDP Annualized eyed
- The Australian Dollar rises despite rising risk-off sentiment amid concerns over impending US auto tariffs.
- The AUD could find support as investors anticipate the Reserve Bank of Australia to maintain interest rates next week.
- US President Donald Trump’s decision to impose a 25% tariff on auto imports has further escalated global trade tensions.
The Australian Dollar (AUD) appreciates against the US Dollar (USD) on Thursday despite the increased risk aversion amid concerns over impending US auto tariffs. The AUD/USD pair weakened following President Donald Trump’s decision late Wednesday to impose a 25% tariff on auto imports, further escalating global trade tensions. The tariffs are set to take effect on April 2, with collection beginning the following day.
President Trump suggested plans on Wednesday to impose tariffs on copper imports within weeks, although the Commerce Department initially had until November 2025 to decide on the matter. This development, however, provided some support for the AUD, as Australia is a key copper exporter, and the potential tariff move lifted commodity prices.
The AUD could find further support as investors expect the Reserve Bank of Australia (RBA) to keep interest rates steady next week. This past February, the RBA made its first 25-basis-point rate cut in four years.
RBA Assistant Governor (Economic) Sarah Hunter reiterated the central bank’s cautious approach to further rate cuts, with February’s policy statement signaling a more conservative stance than market expectations, particularly in response to US policy shifts and their impact on Australia’s inflation outlook.
Australian Dollar advances as US Dollar struggles amid lower yields
- The US Dollar Index (DXY), which measures the USD against six major currencies, is retreating from recent gains and trading around 104.50. The greenback is under pressure as US Treasury yields decline, with the 2-year and 10-year yields hovering at 4.0% and 4.34%, respectively.
- Traders are closely watching upcoming US economic data, including weekly Initial Jobless Claims and the final Q4 Gross Domestic Product (GDP) Annualized report, set for release on Thursday.
- According to Reuters, Trump will grant up to a one-month reprieve for auto parts imports from his proposed 25% automobile tariffs. The proclamation states that while automobiles will be subject to the 25% tariff starting at 04:01 GMT on April 3, auto parts will face the tariff at a later date, to be specified in a Federal Register notice, but no later than May 3, 2025.
- St. Louis Fed President Alberto Musalem made strong remarks on Wednesday, joining a growing number of Fed policymakers warning about the Trump administration’s tariff policies. Musalem cautioned that these measures are disrupting the stable US economy, increasing uncertainty, and driving inflation higher.
- Minneapolis Fed President Neel Kashkari emphasized that work remains to be done on inflation, stating, "The job market has stayed strong, but the biggest challenge is to finish the job." Kashkari also noted that policy uncertainty is making the Fed's task more complex.
- Expectations of Chinese stimulus could boost the Australian economy, given strong trade ties between the two nations. China’s Communist Party and State Council have proposed measures to "vigorously boost consumption" by raising wages and easing financial burdens—an effort to restore consumer confidence and revitalize the struggling economy.
- President Trump announced plans on Wednesday to reduce tariffs on China to facilitate ByteDance's sale of TikTok's US operations. While he emphasized that the tariffs hold greater value than TikTok itself, he suggested that a minor tariff reduction could aid in finalizing the deal. Trump also hinted at the possibility of extending the deadline for the TikTok sale once again.
- Australia’s Monthly Consumer Price Index (CPI) rose 2.4% year-over-year in February, slightly below January’s 2.5% increase and market expectations of 2.5%.
- Australian Treasurer Jim Chalmers presented the 2025/26 budget on Tuesday, outlining key economic forecasts and tax cuts totaling approximately A$17.1 billion across two rounds. The budget deficit is projected at A$27.6 billion for 2024-25 and A$42.1 billion for 2025-26. GDP growth is expected to reach 2.25% in the fiscal year 2026 and 2.5% in 2027. The tax cuts appear to be aimed at strengthening political support.
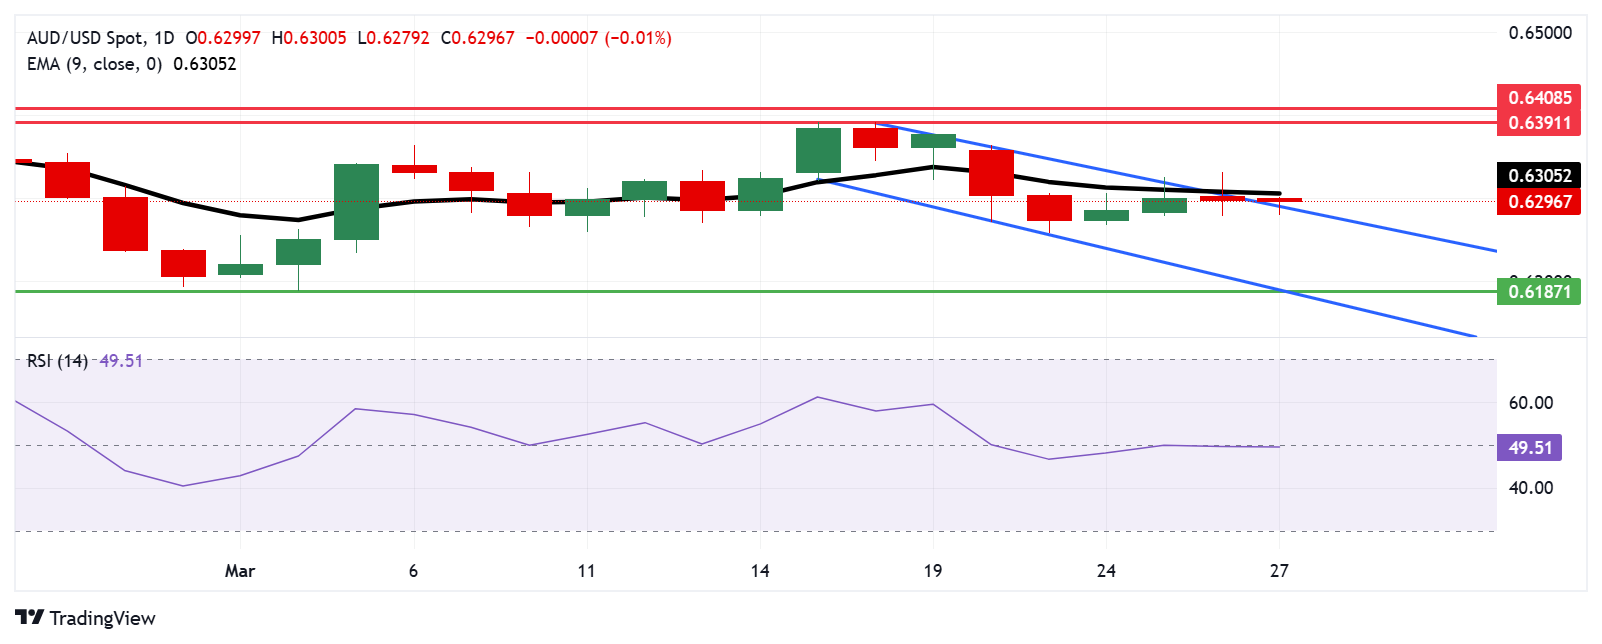
Technical Analysis: Australian Dollar hovers around 0.6300, nine-day EMA
AUD/USD is trading near 0.6290 on Thursday, with technical indicators hinting at a potential bullish shift as the pair attempts to break above its descending channel pattern. However, the 14-day Relative Strength Index (RSI) still remains just below 50, indicating that bearish pressure is still present.
The nine-day Exponential Moving Average (EMA) at 0.6305 is serving as an immediate resistance level. A breakout above this point could strengthen short-term price momentum, paving the way for a test of the monthly high at 0.6391, last seen on March 18.
Conversely, failure to sustain gains could see the AUD/USD pair re-enter its descending channel, reinforcing the bearish outlook. This scenario may drive the pair toward the seven-week low of 0.6187, recorded on March 5, which aligns with the channel’s lower boundary.
AUD/USD: Daily Chart
Australian Dollar PRICE Today
The table below shows the percentage change of Australian Dollar (AUD) against listed major currencies today. Australian Dollar was the strongest against the US Dollar.
| USD | EUR | GBP | JPY | CAD | AUD | NZD | CHF | |
|---|---|---|---|---|---|---|---|---|
| USD | -0.24% | -0.21% | -0.27% | -0.01% | -0.19% | -0.24% | -0.13% | |
| EUR | 0.24% | 0.01% | -0.05% | 0.23% | 0.01% | -0.02% | 0.09% | |
| GBP | 0.21% | -0.01% | -0.04% | 0.20% | 0.00% | -0.04% | 0.08% | |
| JPY | 0.27% | 0.05% | 0.04% | 0.26% | 0.05% | -0.00% | 0.13% | |
| CAD | 0.00% | -0.23% | -0.20% | -0.26% | -0.18% | -0.23% | -0.12% | |
| AUD | 0.19% | -0.01% | -0.01% | -0.05% | 0.18% | -0.04% | 0.08% | |
| NZD | 0.24% | 0.02% | 0.04% | 0.00% | 0.23% | 0.04% | 0.12% | |
| CHF | 0.13% | -0.09% | -0.08% | -0.13% | 0.12% | -0.08% | -0.12% |
The heat map shows percentage changes of major currencies against each other. The base currency is picked from the left column, while the quote currency is picked from the top row. For example, if you pick the Australian Dollar from the left column and move along the horizontal line to the US Dollar, the percentage change displayed in the box will represent AUD (base)/USD (quote).
Economic Indicator
Gross Domestic Product Annualized
The real Gross Domestic Product (GDP) Annualized, released quarterly by the US Bureau of Economic Analysis, measures the value of the final goods and services produced in the United States in a given period of time. Changes in GDP are the most popular indicator of the nation’s overall economic health. The data is expressed at an annualized rate, which means that the rate has been adjusted to reflect the amount GDP would have changed over a year’s time, had it continued to grow at that specific rate. Generally speaking, a high reading is seen as bullish for the US Dollar (USD), while a low reading is seen as bearish.
Read more.Next release: Thu Mar 27, 2025 12:30
Frequency: Quarterly
Consensus: 2.3%
Previous: 2.3%
Source: US Bureau of Economic Analysis
The US Bureau of Economic Analysis (BEA) releases the Gross Domestic Product (GDP) growth on an annualized basis for each quarter. After publishing the first estimate, the BEA revises the data two more times, with the third release representing the final reading. Usually, the first estimate is the main market mover and a positive surprise is seen as a USD-positive development while a disappointing print is likely to weigh on the greenback. Market participants usually dismiss the second and third releases as they are generally not significant enough to meaningfully alter the growth picture.
Forex News
Keep up with the financial markets, know what's happening and what is affecting the markets with our latest market updates. Analyze market movers, trends and build your trading strategies accordingly.