
AUD/NZD Price Prediction: Three Black Crows reversal pattern a bearish omen
- AUD/NZD has confirmed a bearish reversal pattern after peaking in late November.
- The MACD has crossed below its signal line providing a sell signal.
AUD/NZD has completed a Three Black Crows candlestick pattern (red rectangle on chart) after peaking at the November 25 multi-month high.
AUD/NZD Daily Chart
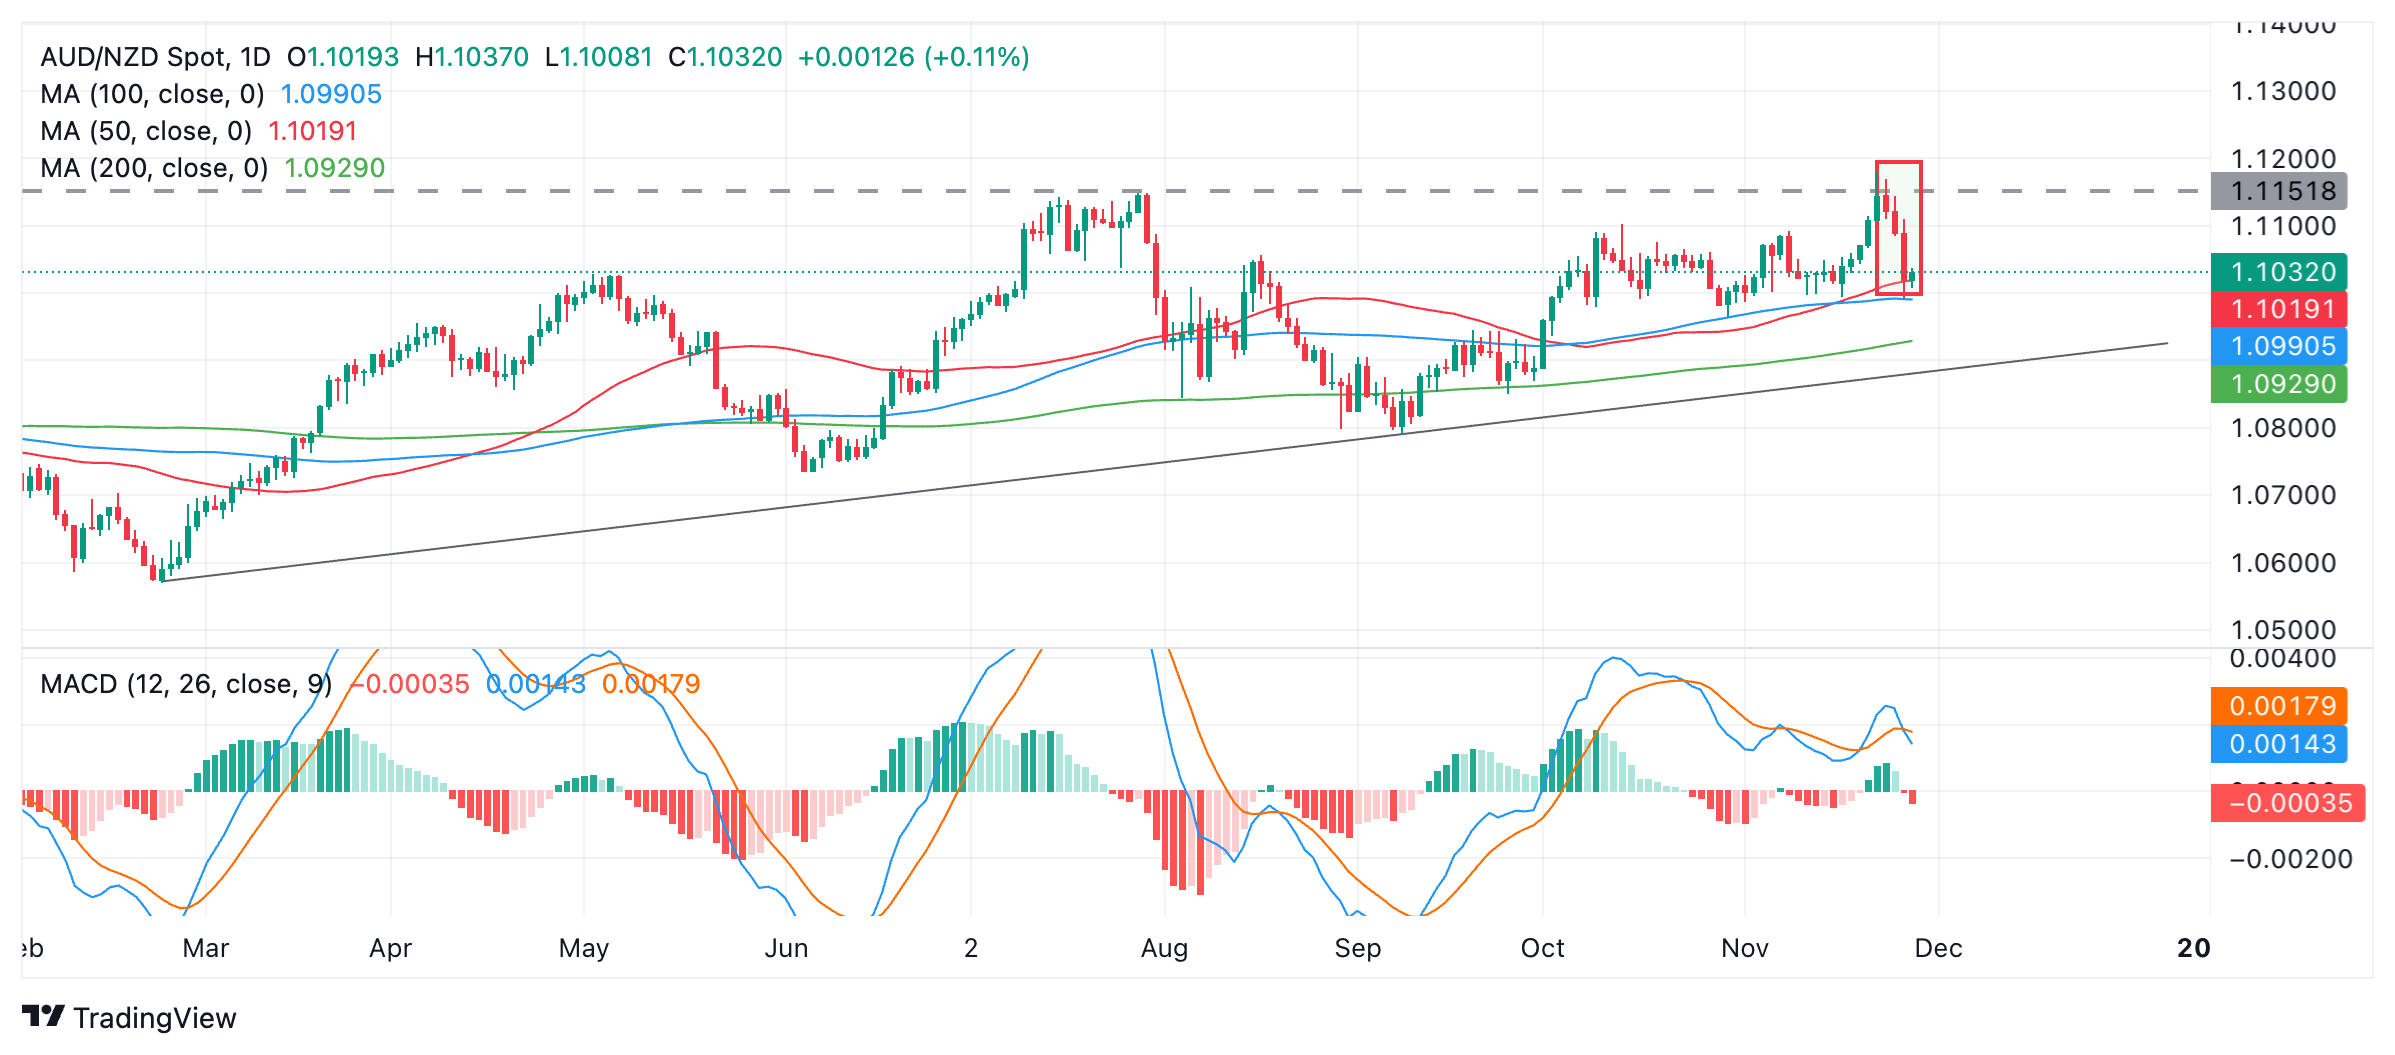
The Three Black Crows is a Japanese candlestick pattern which occurs after a market peak, when three red down days occur consecutively. Such a pattern indicates the odds favor AUD/NZD moving to lower lows.
The (blue) Moving Average Convergence Divergence (MACD) has crossed below its red signal line, giving a sell signal and reinforcing the bearish candlestick pattern.
Support lies first at the 200-day Simple Moving Average (SMA) at 1.9029 and then at the trendline for the broader uptrend at around 1.0900.
A break below the low of the Three Black Crows at 1.0992 would confirm a continuation to the above-mentioned targets.
Forex News
Keep up with the financial markets, know what's happening and what is affecting the markets with our latest market updates. Analyze market movers, trends and build your trading strategies accordingly.