USD/CAD Price Prediction: More downside expected as wave C extends
- USD/CAD has pulled back within a strong downtrend.
- It will probably continue falling as the wave C of a Measured Move unfolds.
USD/CAD has pulled back within the midst of a strong downtrending move. On Wednesday the pair recouped about half the losses from the previous day and formed a Marubozu Japanese candlestick continuation pattern. These are long red candles that close near their lows.
It is often the case that the market will retrace 50% of the Marubozu, which is what happened on Wednesday. Thursday sees a renewal of weakness so far.
USD/CAD Daily Chart
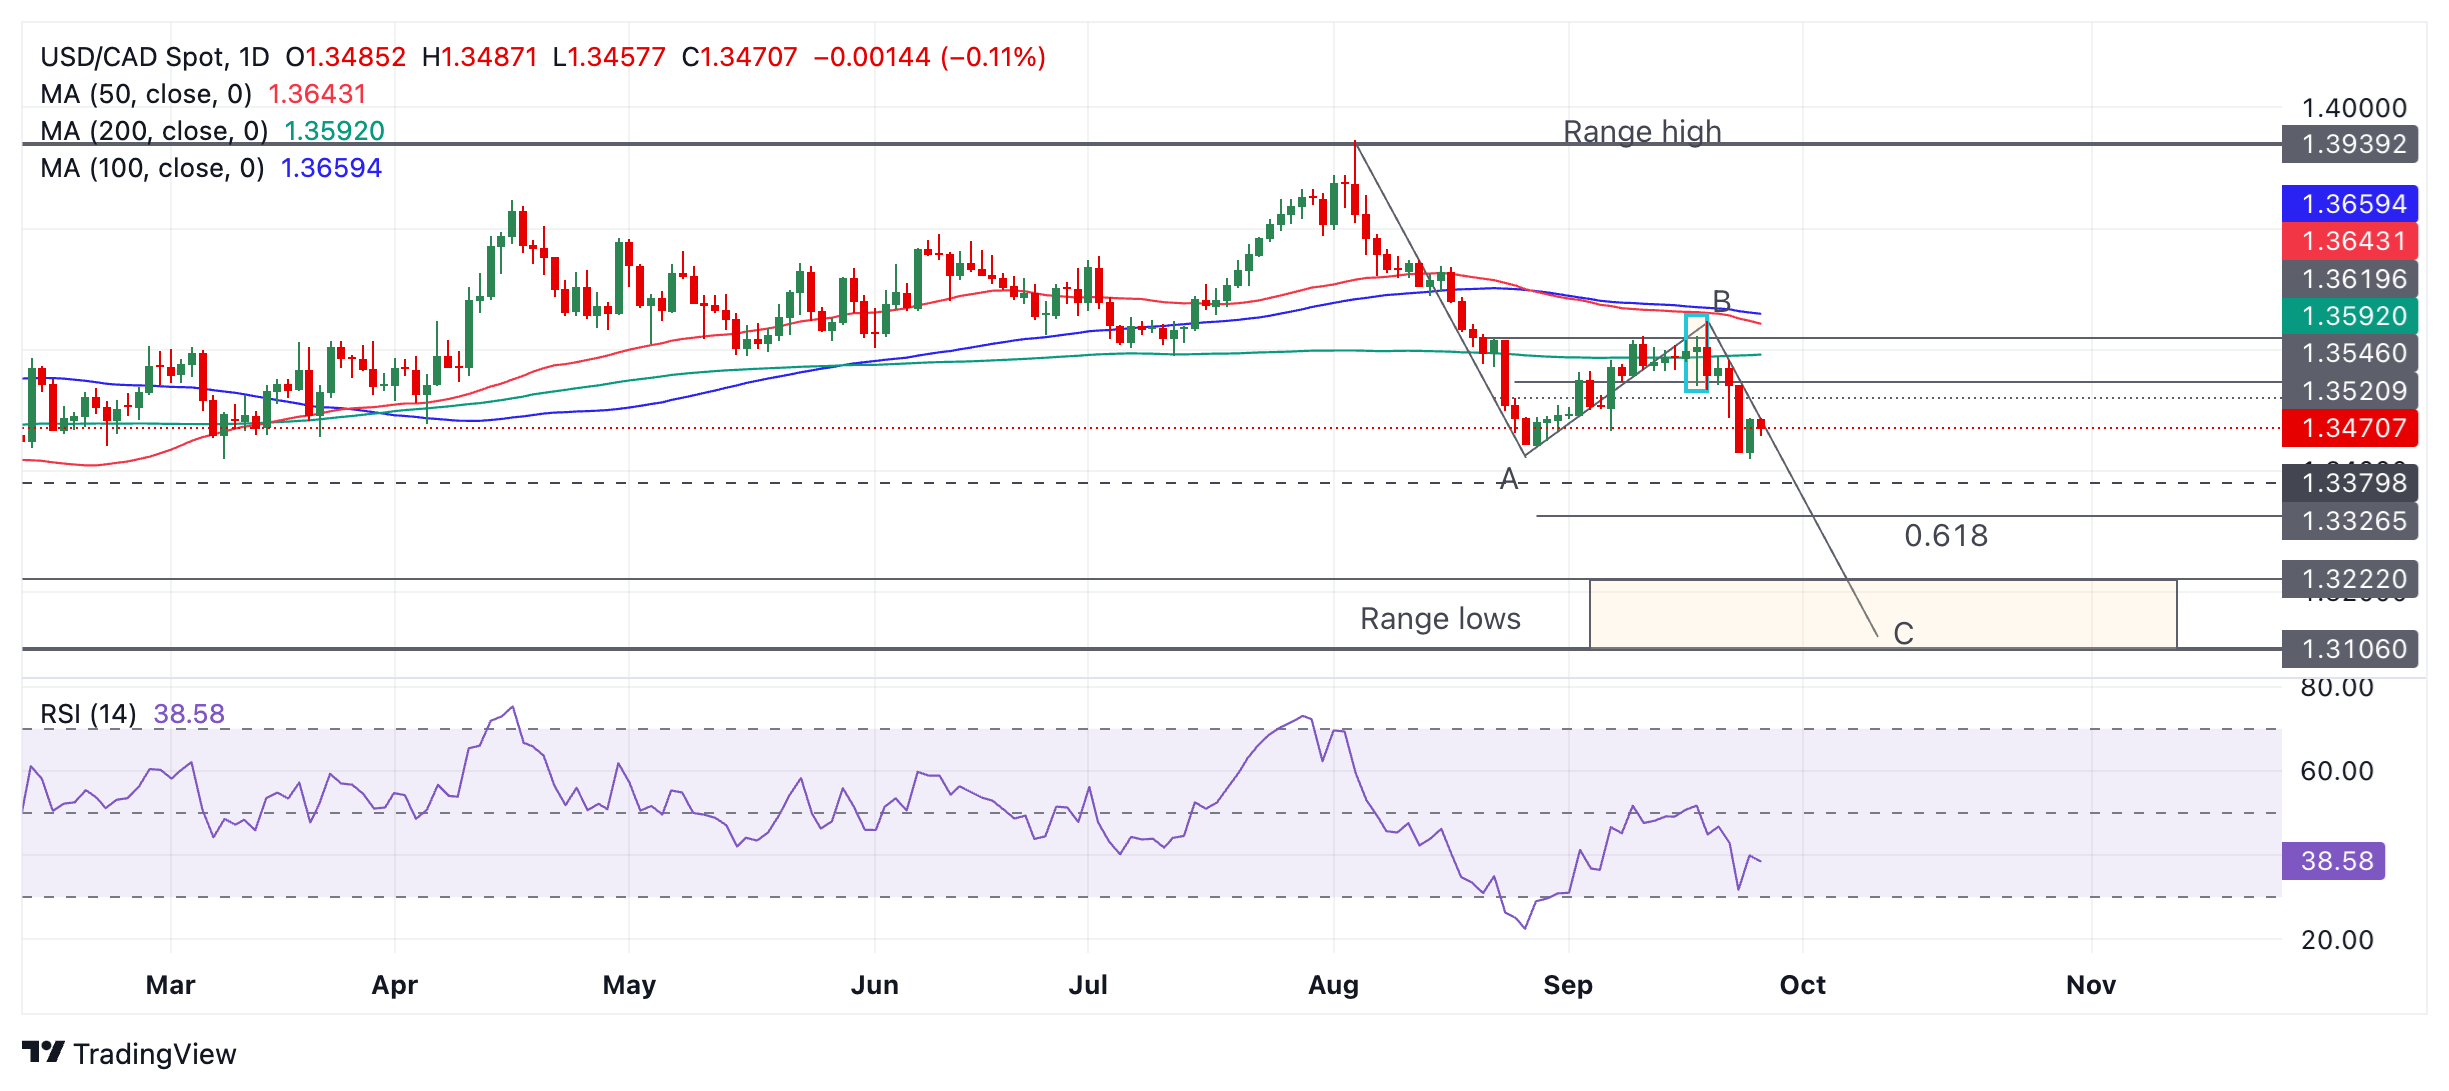
USD/CAD’s move down from the range high, which started on August 5, looks like an ABC pattern, otherwise known as a “Measured Move” (see labels on chart above). Such patterns are like large zig-zags. The wave C usually reaches a similar length to wave A, or at a minimum a Fibonacci 61.8% of A.
Assuming USD/CAD is in a wave C it will probably continue to unfold despite the present pullback. It should reach at least the conservative target for the pattern at 1.3326, the Fibonacci 61.8% extrapolation of wave A. In a very bearish case it could fall to the zone of the range lows (orange shaded rectangle on chart above).
A break below the low of the Marubozu candle at around 1.3419 would provide bearish confirmation of more downside to the aforesaid targets.
Forex News
Keep up with the financial markets, know what's happening and what is affecting the markets with our latest market updates. Analyze market movers, trends and build your trading strategies accordingly.