
GBP/USD Price Analysis: Advances to near 1.2550 with expectations of a momentum shift
- GBP/USD gains ground as technical indicators suggest a momentum shift for the pair.
- The momentum indicator could confirm a weakening of the bearish bias once it breaks above the centerline.
- The pair could meet the immediate barrier at the upper boundary of the descending channel around 1.2570 level.
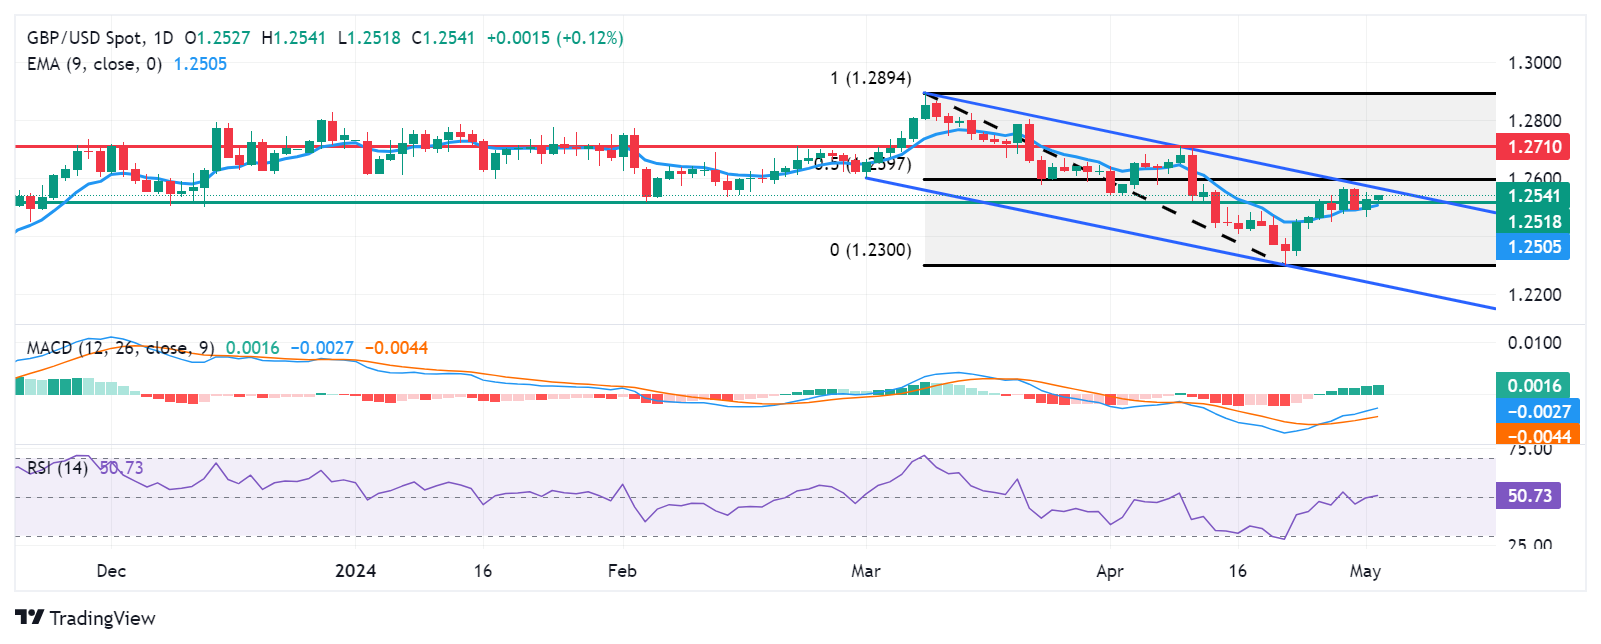
GBP/USD extends its gains for the second successive session on Thursday, trading around 1.2530 during the Asian session. The pair consolidates within the descending channel on a daily chart, with the 14-day Relative Strength Index (RSI) positioning on the 50-level. A further increase will indicate the weakening of a bearish bias.
Additionally, the Moving Average Convergence Divergence (MACD) indicates a momentum shift as it is positioned above the signal line but below the centerline. This momentum indicator could confirm the weakening of the bearish bias once it breaks above the centerline.
The GBP/USD pair could test the immediate throwback support at the 1.2518 level, followed by the nine-day Exponential Moving Average (EMA) at 1.2504 and the psychological level of 1.2500. A break below this level could exert pressure on the pair to navigate the region around the six-month low of 1.2300, followed by the lower boundary of the descending channel around the level of 1.2240.
On the upside, the immediate resistance appears at the upper boundary of the descending channel around the level of 1.2570 followed by the 50% retracement level at 1.2597 level, plotting between the range of 1.2894 and 1.2300.
A breakthrough above the latter could support the GBP/USD pair to explore the area around the pullback resistance at the 1.2710 level.
GBP/USD: Daily Chart
Forex News
Keep up with the financial markets, know what's happening and what is affecting the markets with our latest market updates. Analyze market movers, trends and build your trading strategies accordingly.