USD/JPY gains following dismal US consumer report
- USD/JPY climbs after worse-than-expected US consumer sentiment data.
- Recession fears reignited as Americans became less optimistic about the economy.
- A jump in US inflation expectations underpins US yields and the Greenback.
The USD/JPY advanced steadily during the North American session, following a worse-than-expected University of Michigan (UoM) poll that showed that American consumers are becoming pessimistic about the economy. Despite that, the major trades at 155.83, up 0.24%.
USD/JPY rises after UoM Consumer Sentiment survey, eyes on next week US inflation
The UoM Consumer Sentiment Index retreated in May from 77.2 in April to 67.4, missing analysts’ estimates of 76. According to Joanne Hsu, the Director of the UoM Survey, the 10-point decline “is statistically significant and brings sentiment to its lowest reading in about six months.” According to the survey, Americans are becoming concerned about inflation, unemployment, and interest rates.
Inflation expectations for one year rose from 3.2% to 3.5% in May and stood at 3.1%, a tenth up from 3.0% for a ten-year period.
The US 10-year Treasury note yield rose four basis points (bps) to 4.498% following the data release. The US Dollar Index (DXY) has also advanced 0.14%, up to 105.35, as recession fears reignited, as the UoM survey suggests consumer spending could weaken in the near term.
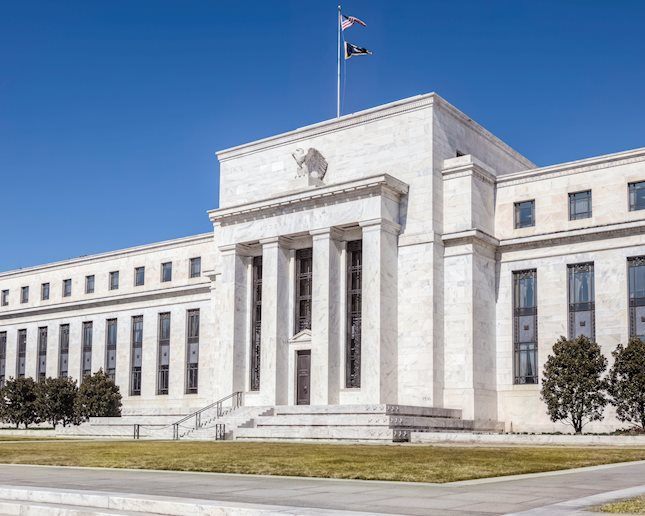
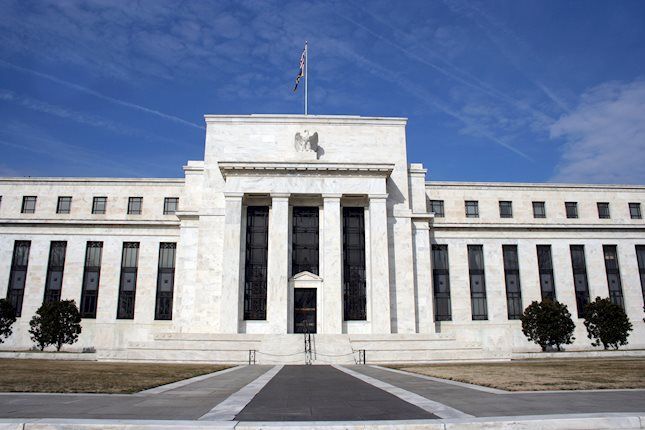
In the meantime, two Federal Reserve officials had crossed the newswires. Fed Governor Michelle Bowman commented that the US central bank should proceed “carefully and deliberately.” Her colleague, the Dallas Fed Lorie Logan, said it's too early to think about cutting rates.
Next week, the US docket will feature the release of inflation figures, retail sales, building permits, and Fed speeches.
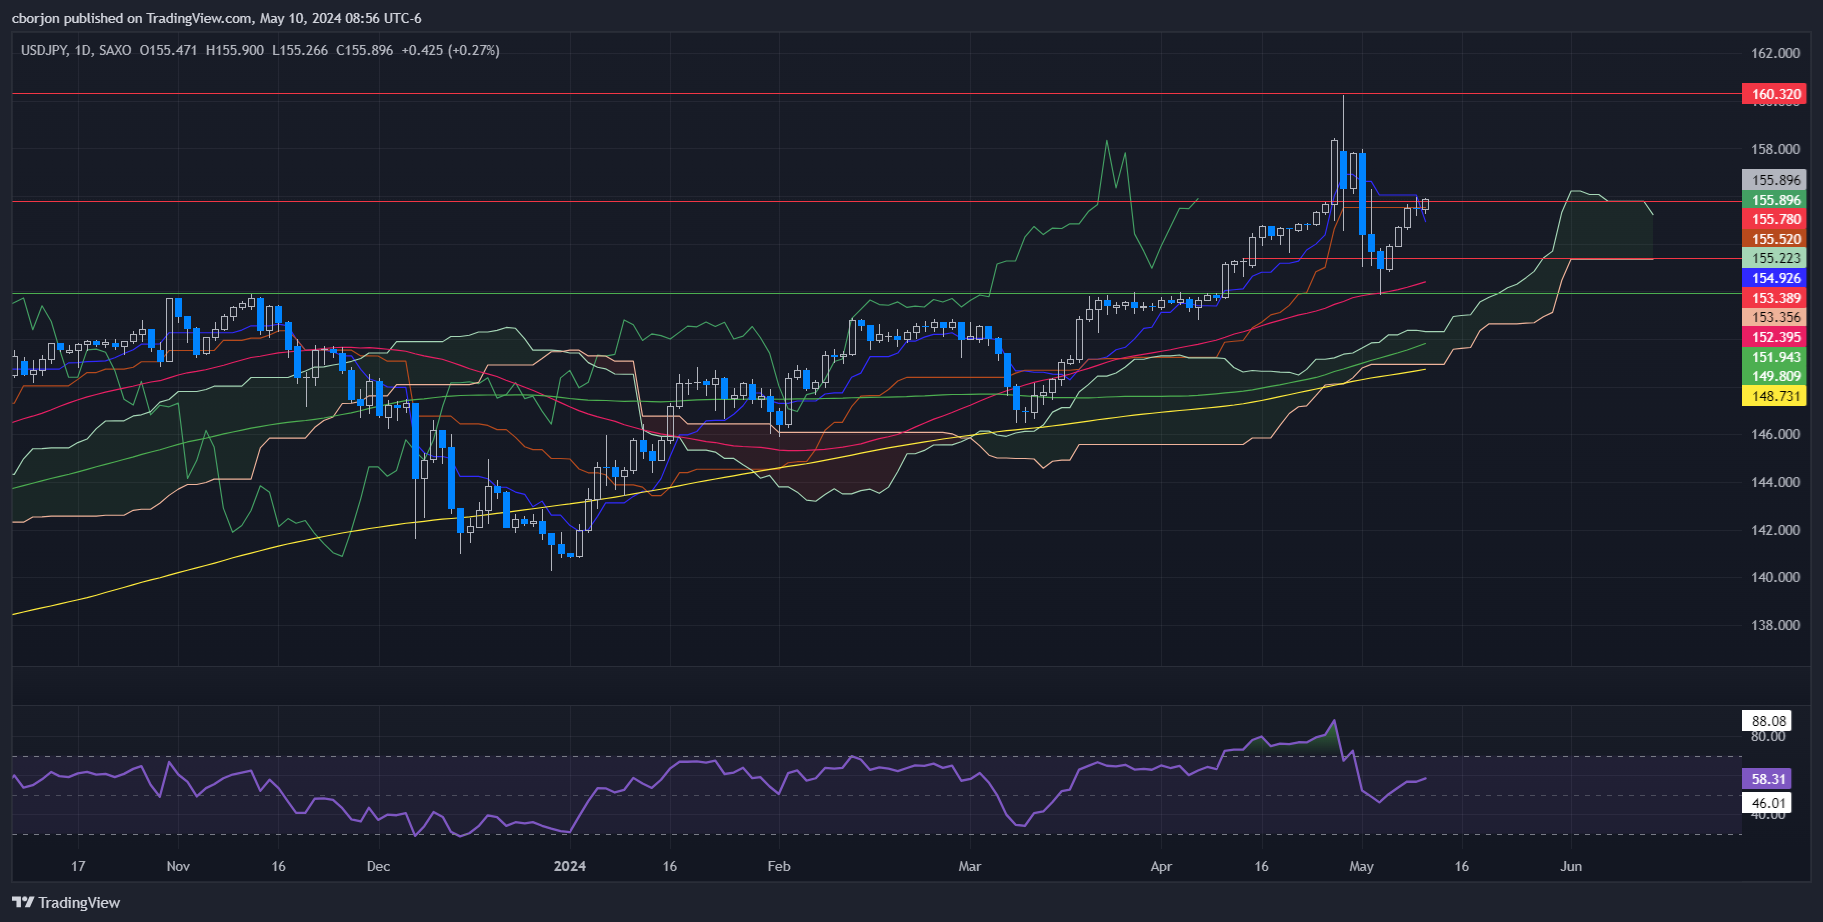
USD/JPY Price Analysis: Technical outlook
From a technical standpoint, the USD/JPY rally is set to continue, as momentum is on the side of buyers, as depicted by the Relative Strength Index (RSI). That, along with prices standing above the Ichimoku Cloud, could pave the way for bulls to challenge 156.00 in the near term. On the other hand, a drop below the Kijun-Sen at 155.78 could pave the way to challenge the Senkou Span A at 155.22, followed by the Tenkan Sen at 154.92.
Forex News
Keep up with the financial markets, know what's happening and what is affecting the markets with our latest market updates. Analyze market movers, trends and build your trading strategies accordingly.