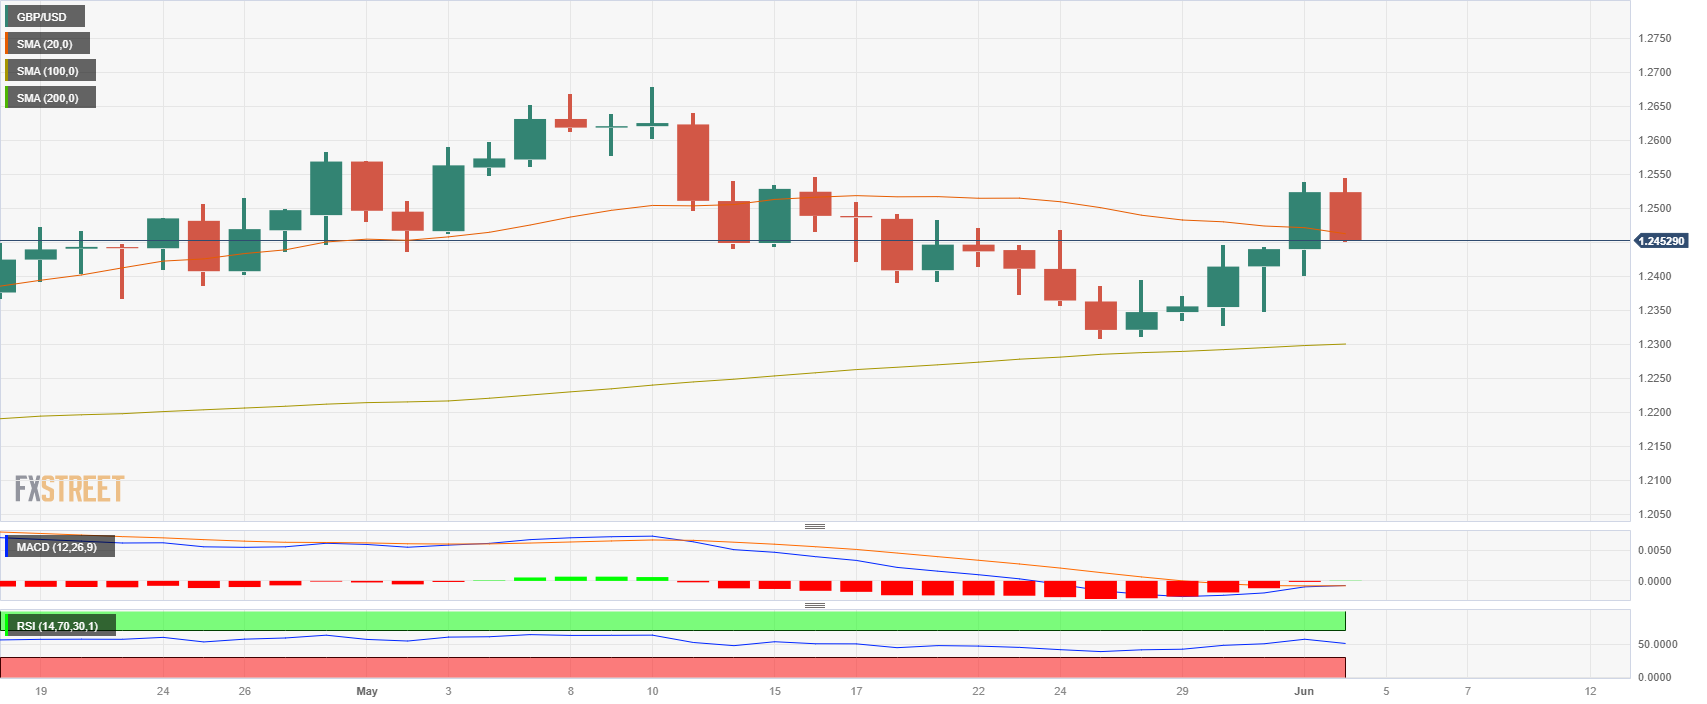
GBP/USD loses the 20-day SMA post US NFP
- Cable fell below the 20-day SMA toward the 1.2450 area.
- The US added 339k new jobs in May vs 190k expected.
- US bond yields increased as a reaction to the employment figures.
The GBP/USD fell more than 0.50% to a daily low of 1.2453 at the end of the week, following robust labor market data from the US, indicating a possible reconsideration of further rate hikes by the Federal Reserve (Fed). As a result, the US Dollar strengthened due to rising US bond yields, while the Sterling Pound continued to face selling pressure while the British economic calendar had nothing relevant to offer.
Robust labor market made markets reconsider a possible hike by the Fed
The US Bureau of Labor Statistics revealed that employment in the US increased by 339k, surpassing the consensus forecast of 190k. However, the Unemployment rate rose to 3.7% compared to the expected 3.5%. Wage inflation, measured by Average Hourly Earnings, stood at 4.3% YoY, slightly lower than the anticipated 4.4%.
Despite labor demand beginning to exhibit signs of deceleration, the robust employment growth and ongoing inflationary pressures are exerting force on the Fed to contemplate interest rate hikes. This has resulted in an upswing in US bond yields, reflecting heightened market expectations for a 25 basis points hike in the upcoming June meeting. In that sense, the US bond yields are experiencing increases across the curve. The 10-year bond yield increased by 2.33%, reaching 3.68%. Similarly, the 2-year yield stands at 4.50% with a gain of 4.69%, and the 5-year yield is at 3.83% up by 3.53%.
However, as per the CME FedWatch tool, markets are still discounting higher odds of no hike, although the case for a 25 bps gain has strengthened. Before the meeting, the Federal Open Market Committee will know the May inflation reading, which will finally model the expectations for their next interest rate decision.
Levels to watch
The GBP/USD holds a slightly bearish outlook for the short term, as per the daily chart. The Relative Strength Index (RSI) fell towards its midpoint while Moving Average Convergence Divergence (MACD) turned flat. However the pair still holds above the 100 and 200-day Simple Moving Averages (SMA) while bulls try to retake the 20-day rolling average at the 1.2460 zone.
If the Cable falls, immediate support levels are seen at the daily low area around 1.2350 and the 1.2400 level. Furthermore, to regain traction the bulls must consolidate the 20-day SMA at the 1.2461 area. Above, resistances stand at 1.2480 and 1.2500.

Forex News
Keep up with the financial markets, know what's happening and what is affecting the markets with our latest market updates. Analyze market movers, trends and build your trading strategies accordingly.
