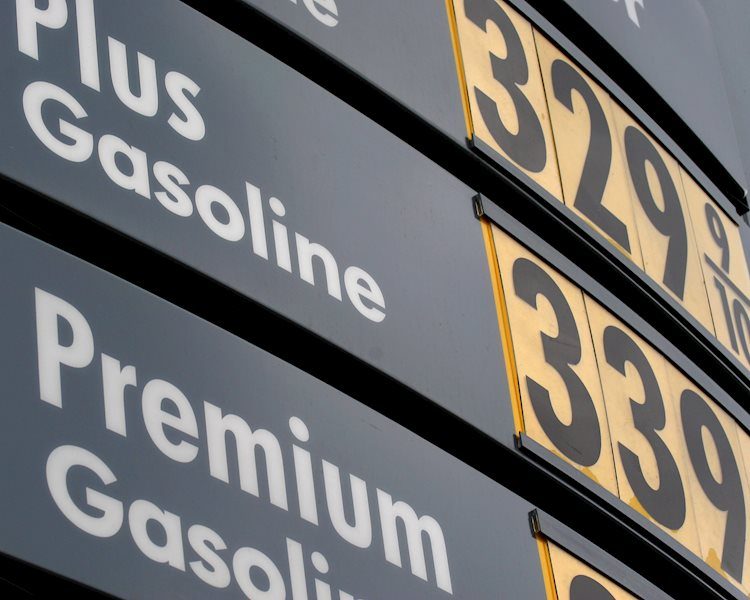
WTI holds below $82.00 on easing Middle East tensions, hawkish Fed
- WTI loses momentum to nearly one-month lows of $82.00 on Tuesday.
- Easing tensions between Israel and Iran limits the WTI’s downside.
- A large build in the US stockpile in recent weeks and a hawkish Fed weigh on the black gold.
Western Texas Intermediate (WTI), the US crude oil benchmark, is trading around $82.00 on Tuesday. The black gold edges lower on the day as the concerns about a wider Middle East war fade. Later on Tuesday, oil traders will take more cues from the preliminary US S&P Global Purchasing Managers Index (PMI) data for April and the API Weekly Crude Oil Stock report.
Iranian Foreign Minister Hossein Amirabdollahian said on Friday that Iran does not plan to respond to Israel’s retaliatory strike launched, while Israeli authorities remained mostly silent. The absence of public statements afterward tends to imply that both sides are attempting to ease tensions. WTI prices drop to nearly monthly low as Israel's retaliatory attack on Iran was smaller than had been feared. However, any escalating tensions between Israel and Iran could limit the WTI’s downside from its lower price levels.
The increase in US crude oil inventories in recent weeks surpassed expectations, which exerts downward pressure on WTI prices. Furthermore, the hawkish remarks from the Federal Reserve (Fed) have led to a strong US Dollar (USD) and acts as a headwind for the black gold price. It’s worth noting that a strong dollar makes oil more expensive for holders of other currencies. Chicago Fed Austan Goolsbee said last week that with the strength of the labour market and elevated inflation, he believes the Fed's current restrictive monetary policy is appropriate, per Reuters.
On the other hand, hope for Chinese demand might offer some relief to WTI prices as China is the world's biggest oil importer. The Chinese government aims to accomplish this with the help of fiscal and monetary stimulus measures to lift the economy. ANZ economists expected China's economy to grow 4.9% in 2024, up from 4.2% previously. However, the Chinese property sector remains fragile and it has been a major drag on China's economy. Any negative sign about China’s economy could weigh on the WTI prices.
Forex News
Keep up with the financial markets, know what's happening and what is affecting the markets with our latest market updates. Analyze market movers, trends and build your trading strategies accordingly.