Natural Gas Price Analysis: XNG/USD edges higher within bearish triangle, $2.59 in the spotlight
- Natural Gas picks up bids to reverse the previous weekly loss within a bearish chart formation.
- Sustained trading beyond 100-SMA, mixed oscillators keep XNG/USD bears hopeful.
- Clear downside break of $2.59 could convince Natural Gas sellers to refresh monthly low.
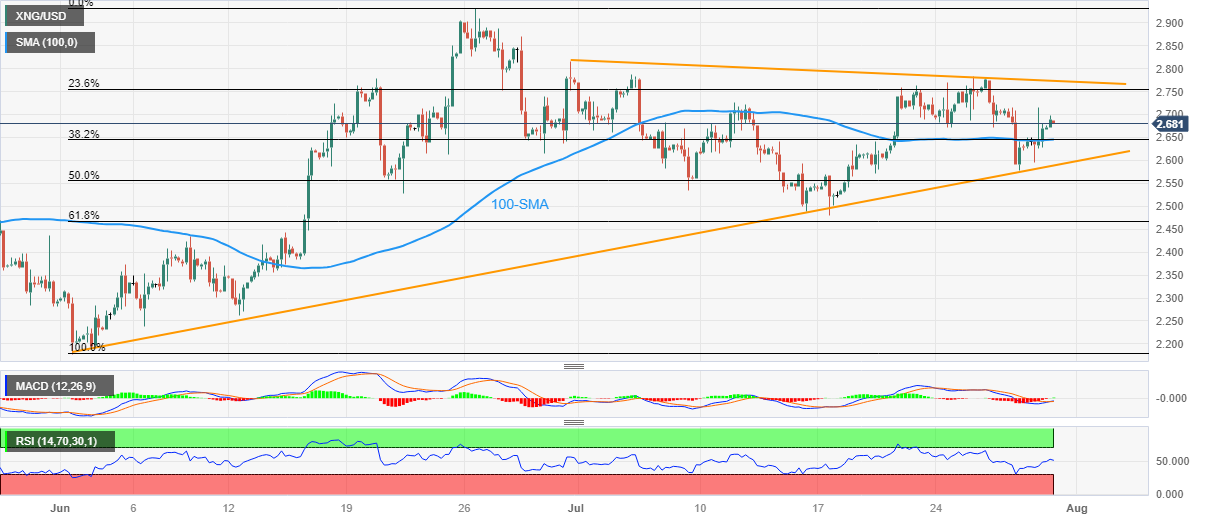
Natural Gas Price (XNG/USD) remains mildly bid near $2.68 amid early Monday morning in Asia. In doing so, the XNG/USD pares the previous weekly loss with mild losses, up 0.45% intraday, as sellers flex muscles within bearish chart formation.
That said, the XNG/USD’s sluggish MACD signals join the gradually improving XNG/USD price. However, the Natural Gas buyers need validation from the downward-sloping resistance line stretched from late June, close to $2.77 by the press time.
Following that, the XNG/USD run-up towards the previous monthly high of around $2.93 and March’s peak of near $3.08 will be in the spotlight.
On the contrary, a clear downside break of the 100-SMA, around $2.65 at the latest, becomes necessary for the XNG/USD bears to retake control.
Even so, the Natural Gas trading beneath the stated triangle’s bottom line, close to $2.59 at the latest, will be a tough nut to crack for the energy instrument before giving them control.
Following that, $2.43 and the previous monthly low of around $2.17 may test the XNG/USD bears before directing them to the theoretical target of below the $2.00 psychological magnet, close to $1.90.
Overall, XNG/USD remains bearish but the downside move needs validation from $2.59 to convince the energy bears.
Natural Gas Price: Four-hour chart
Trend: Limited downside expected
Forex News
Keep up with the financial markets, know what's happening and what is affecting the markets with our latest market updates. Analyze market movers, trends and build your trading strategies accordingly.