
Gold price sits near daily high on weaker USD; focus remains glued to US NFP report
- Gold price gains positive traction and moves away from a two-week low set on Thursday.
- A modest USD downtick lends support to the XAU/USD pair ahead of the US NFP report.
- The optimism over possible US-China trade negotiations might cap the precious metal.
Gold price (XAU/USD) touches a fresh daily high during the early part of the European session on Friday, though the intraday move-up lacks bullish conviction and remains below the $3,260-3,265 support breakpoint. The US Dollar (USD) struggles to capitalize on a three-day-old uptrend to a multi-week high and drifts lower amid prospects for more aggressive policy easing by the Federal Reserve (Fed). Apart from this, some repositioning trade ahead of the release of the US Nonfarm Payrolls (NFP) report acts as a tailwind for the non-yielding yellow metal.
Meanwhile, signs of easing trade tensions between the US and China – the world's two largest economies – and hopes for tariff deals between the US and its trading partners remain supportive of a positive risk tone. This remains supportive of a generally positive risk tone and might hold back traders from placing fresh bullish bets around the safe-haven Gold price. Hence, it will be prudent to wait for strong follow-through buying before confirming that the XAU/USD pair's recent pullback from the $3,500 psychological mark, or the all-time high, has run its course.
Daily Digest Market Movers: Gold price bulls retain intraday control amid modest USD weakness, ahead of US NFP
- China's Commerce Ministry said on Friday that the US has recently, through relevant channels, actively conveyed messages to engage in talks on tariff issues and the country is assessing the proposal to start negotiations. This adds to the optimism over a possible easing of the tit-for-tat tariff war between the world’s two largest economies.
- Moreover, hopes for tariff deals between the US and its trading partners lifted the US Dollar to a three-week high and dragged the Gold price to the $3,200 neighborhood on Thursday. The USD bulls, however, turn cautious amid bets for more aggressive policy easing by the Federal Reserve and ahead of the US Nonfarm Payrolls report.
- Traders ramped up their bets that the US central bank will deliver four quarter-point rate reductions by the year-end after data released this week showed that the US economy unexpectedly contracted for the first time since 2022. Moreover, the Personal Consumption and Expenditure (PCE) Price Index pointed to signs of easing inflation.
- Adding to this, the US ADP report on private-sector employment suggested that the US labor market is cooling. Furthermore, the US Department of Labor reported on Thursday that initial jobless claims increased from 223,000 to 241,000 in the week ended April 26 – marking the highest level since February.
- Meanwhile, the US ISM Manufacturing PMI remained firmly in contraction territory for the second straight month, though it fell less than expected, from 49.0 to 48.7 in April. Traders now look forward to the release of the US monthly employment details for fresh cues about the Fed's policy outlook.
- The popularly known US Nonfarm Payrolls (NFP) report is expected to show that the economy added 130K new jobs in April, sharply lower than 228K in the previous month. The Unemployment Rate, however, is expected to hold steady at 4.2%, while Average Hourly Earnings might have risen by 0.3%.
Gold price needs to surpass $3,260-3,265 barrier to support prospects for any further intraday appreciating move
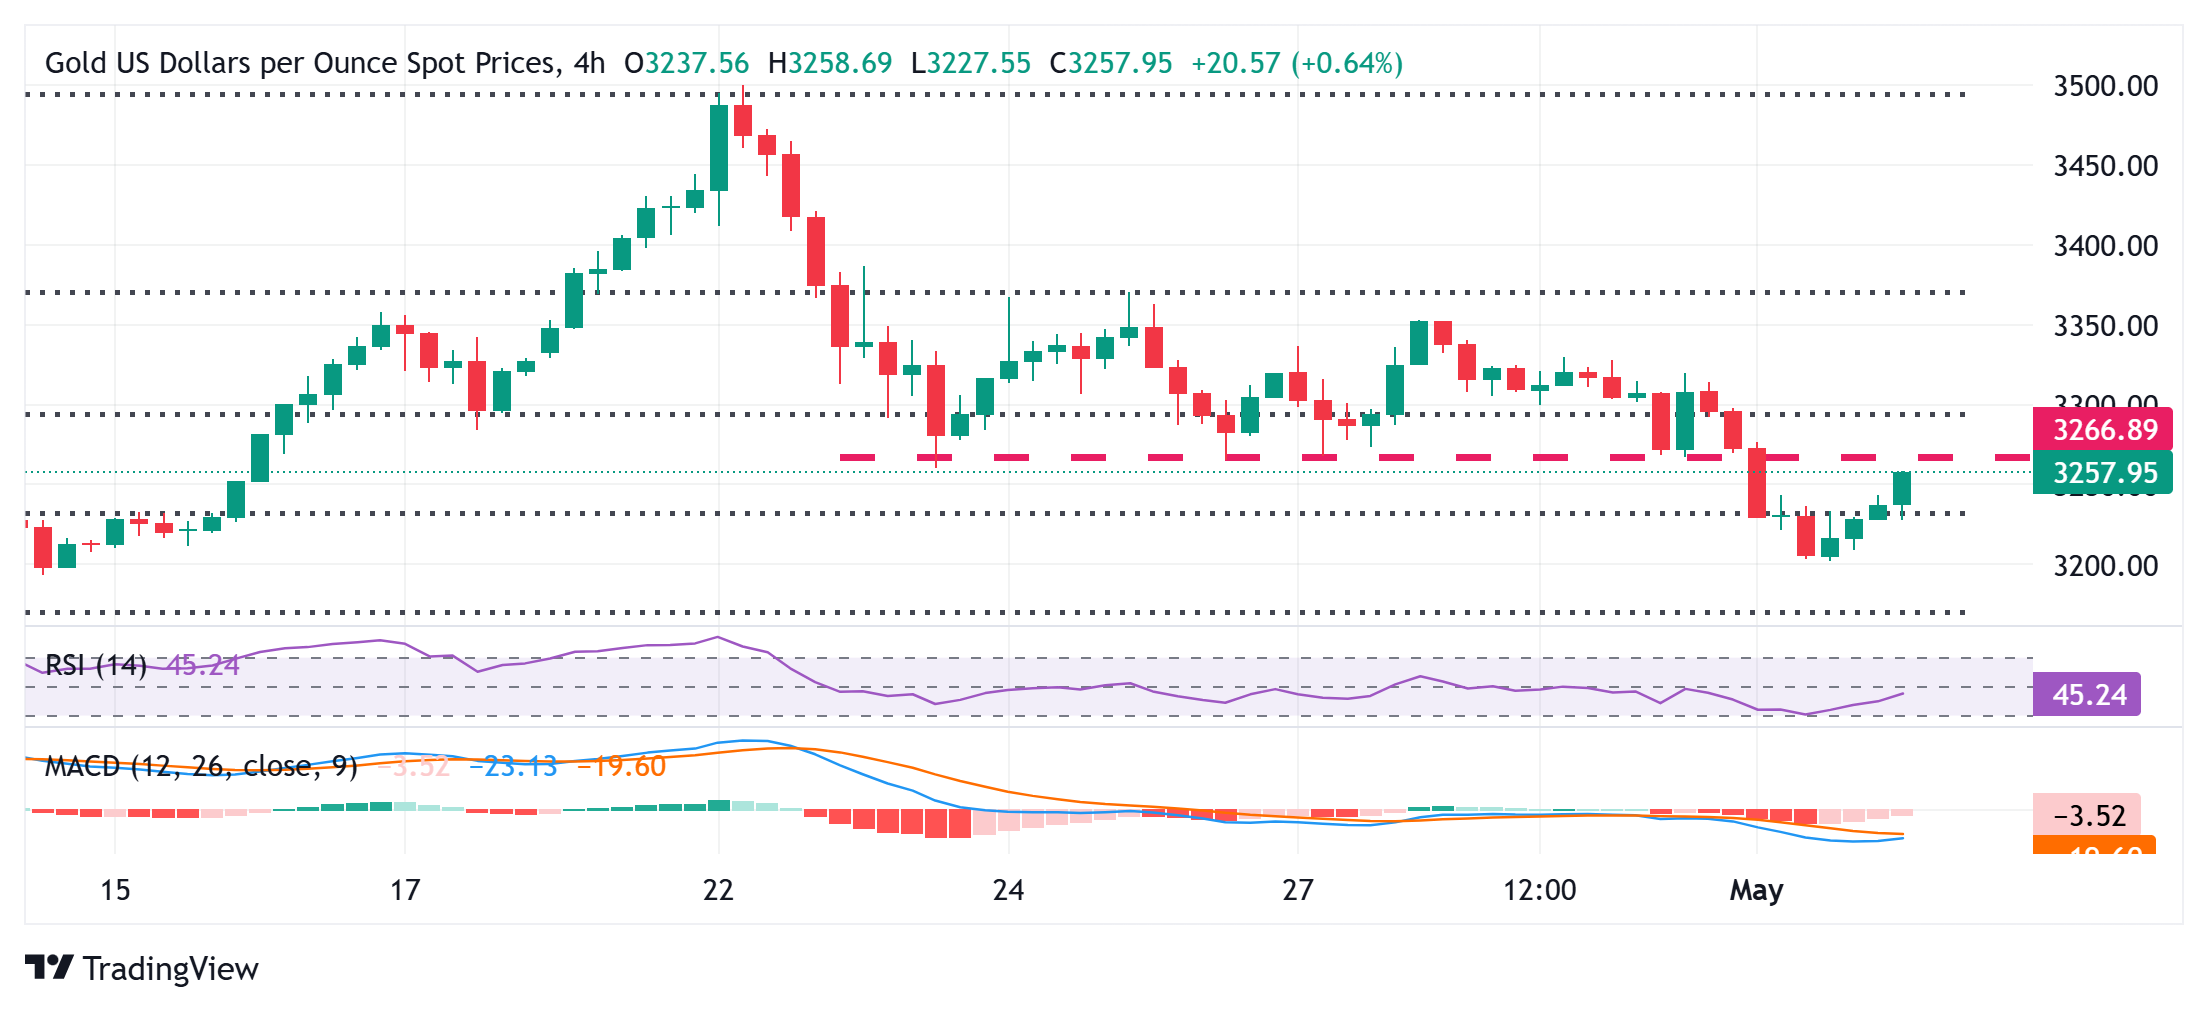
From a technical perspective, the overnight breakdown below the $3,265-3,260 horizontal support and the 50% retracement level of the move higher from the vicinity of mid-$2,900s was seen as a fresh trigger for bearish traders. However, oscillators on the daily chart – though they have been losing positive traction – are yet to confirm the negative outlook. This, in turn, prompts some short-covering move and acts as a tailwind for the Gold price.
That said, the aforementioned support breakpoint, around the $3,260-3,265 region, might cap any further gains, above which the XAU/USD pair might reclaim the $3,300 mark. The latter should act as a key pivotal, which if cleared has the potential to lift the Gold price to the $3,348-$3,350 supply zone. Some follow-through buying will suggest that the corrective slide from the all-time peak has run its course and pave the way for a move to the $3,367-$3,368 area en route to the $3,400 mark.
On the flip side, the 50% retracement level, around the $3,229-$3,228 region, now seems to protect the immediate downside ahead of the overnight swing low, around the $3,202-3,201 area. A convincing break below the latter will reaffirm the near-term negative bias and make the Gold price vulnerable to accelerate the downfall towards the $3,200 round figure en route to the $3,160 zone, representing the 61.8% Fibo. level.
US Dollar PRICE Today
The table below shows the percentage change of US Dollar (USD) against listed major currencies today. US Dollar was the strongest against the British Pound.
| USD | EUR | GBP | JPY | CAD | AUD | NZD | CHF | |
|---|---|---|---|---|---|---|---|---|
| USD | -0.31% | -0.14% | -0.20% | -0.25% | -0.49% | -0.23% | -0.24% | |
| EUR | 0.31% | 0.18% | 0.13% | 0.06% | -0.17% | 0.10% | 0.09% | |
| GBP | 0.14% | -0.18% | -0.06% | -0.10% | -0.33% | -0.07% | -0.08% | |
| JPY | 0.20% | -0.13% | 0.06% | -0.05% | -0.28% | -0.02% | -0.01% | |
| CAD | 0.25% | -0.06% | 0.10% | 0.05% | -0.25% | 0.04% | 0.01% | |
| AUD | 0.49% | 0.17% | 0.33% | 0.28% | 0.25% | 0.27% | 0.26% | |
| NZD | 0.23% | -0.10% | 0.07% | 0.02% | -0.04% | -0.27% | -0.01% | |
| CHF | 0.24% | -0.09% | 0.08% | 0.00% | -0.01% | -0.26% | 0.01% |
The heat map shows percentage changes of major currencies against each other. The base currency is picked from the left column, while the quote currency is picked from the top row. For example, if you pick the US Dollar from the left column and move along the horizontal line to the Japanese Yen, the percentage change displayed in the box will represent USD (base)/JPY (quote).
Forex News
Keep up with the financial markets, know what's happening and what is affecting the markets with our latest market updates. Analyze market movers, trends and build your trading strategies accordingly.