USD/CAD Price Analysis: Extends upside to 1.3750 as US Dollar recovers
- USD/CAD rises to 1.3750, capitalized on the US Dollar’s recovery.
- Fed Kashkari sees progress in disinflation stalling due to the strong housing market.
- Investors await the Canadian Employment data for fresh guidance.
The USD/CAD pair advances to the crucial resistance of 1.3750 in Wednesday’s European session. The Loonie asset strengthens as the US Dollar recovers losses induced by Federal Reserve (Fed) Chair Jerome Powell’s slight less-hawkish guidance on interest rates than expected after the monetary policy decision last week in which he remains leaned towards reducing interest rates this year.
The US Dollar Index (DXY), which tracks the Greenback’s value against six major currencies, extends recovery to 105.50. Due to the light United States economic calendar, investors are projecting the next move in the US Dollar on the basis of Fed Policymakers’ speeches.
On Tuesday, Minneapolis Federal Reserve (Fed) Bank President Neel Kashkari on Tuesday. Neel Kashkari cited concerns over stalling progress in disinflation due to housing market strength and warned that interest rates are needed to remain where they are possibly for the entire year.
This week, the Canadian Dollar will be guided by the Employment data for April, which will be published on Friday. The Canadian job market is estimated to have expanded by fresh 20K payrolls against a drawdown of 2.2K. The Unemployment Rate is anticipated to have risen to 6.2% from 6.1%. The labor market data will significantly influence the Bank of Canada’s (BoC) interest rate outlook.
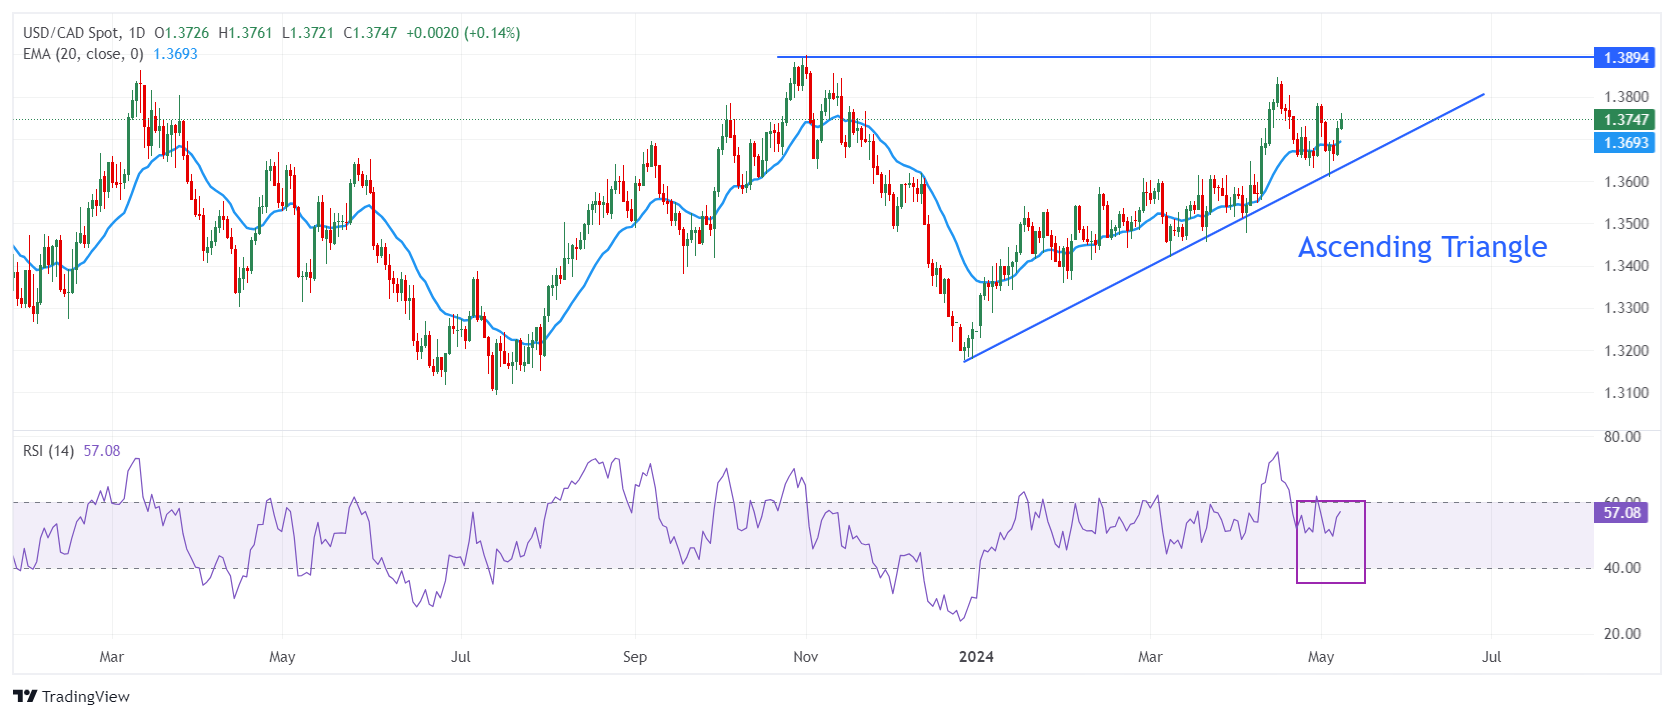
USD/CAD recovers strongly after discovering buying interest near the upward-sloping border of the Ascending Triangle formation on a daily timeframe, which is plotted from December 27 low at 1.3178. The horizontal resistance of the above-mentioned chart pattern is placed from November 1 high around 1.3900.
The 20-day Exponential Moving Average (EMA) near 1.3700 continues to provide support to the US Dollar bulls.
The 14-period Relative Strength Index (RSI) oscillates in the 40.00-60.00 range, suggesting indecisiveness among investors.
Fresh buying opportunity would emerge if the asset breaks above April 30 high at 1.3785. This would drive the asset towards April 17 high at 1.3838, followed by the round-level resistance of 1.3900.
In an alternate scenario, a breakdown below May 3 low around 1.3600 will expose the asset to the April 9 low around 1.3547 and the psychological support of 1.3500.
USD/CAD daily chart
Forex News
Keep up with the financial markets, know what's happening and what is affecting the markets with our latest market updates. Analyze market movers, trends and build your trading strategies accordingly.