GBP/USD Price Analysis: Recovers above 1.2500 as ‘hammer’ hints buyers in charge
- GBP/USD has been trading volatile after the BoE’s decision; stands above 1.2500.
- BoE’s Bailey sounded dovish after stating they would need to lower rates below what’s priced in.
- Thursday’s price action is forming a ‘hammer,’ hinting further upside is seen.
The Pound Sterling erased some of its earlier losses against the US Dollar and edged up by 0.03% after the Bank of England’s (BoE) monetary policy decision. The GBP/USD traded at 1.2503 after hitting a low of 1.2445.
Earlier, the BoE held rates unchanged in a 7-2 split vote, with David Ramsden and Swati Dhingra voting for a quarter of a percentage point. After releasing its monetary policy statement, the BoE hosted a press conference. BoE Governor Andrew Bailey stated the central bank would need to cut rates more than it is currently priced by market rates.
GBP/USD Price Analysis: Technical outlook
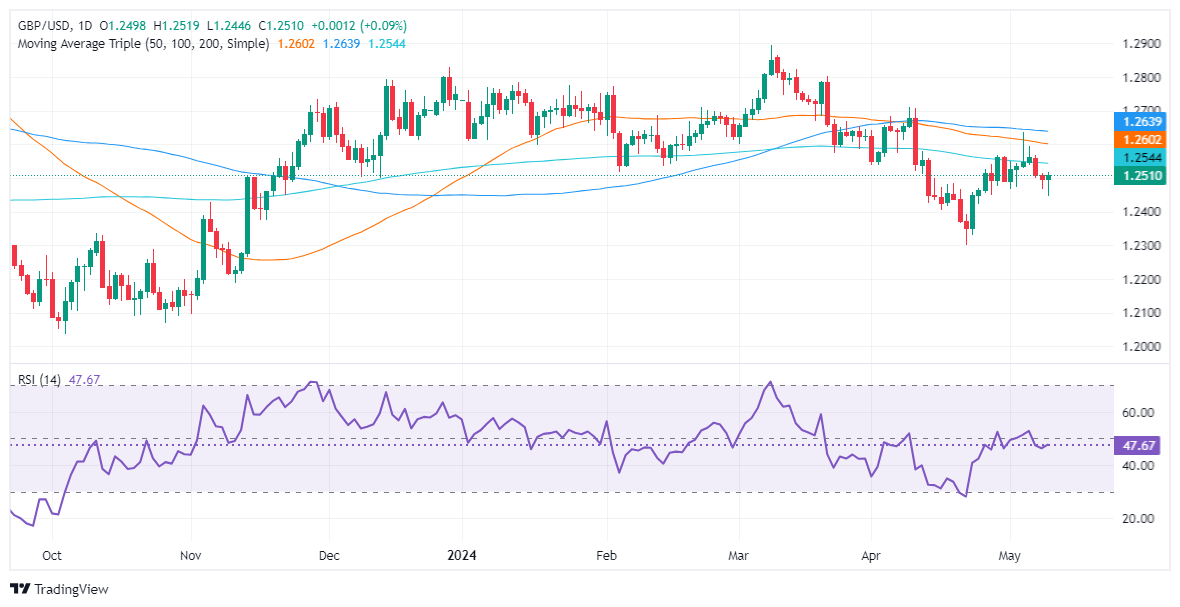
Given the fundamental backdrop, the GBP/USD remains neutral with a downward bias, with the pair failing to crack the 200-day moving average (DMA) decisively. Even though momentum favors sellers, as depicted by the Relative Strength Index (RSI) being in bearish territory, they would also need to push the exchange rate back below 1.2500.
In that outcome, the GBP/USD next support would be the May 9 low of 1.2445, followed by the 1.2400 figure. Below this level, the next major support level emerges at the year-to-date (YTD) low of 1.2299.
It should be said that today’s price action is forming a ‘hammer.’ With that said, if buyers clear the 200-DMA at 1.2542, the next resistance would be the confluence of the May 6 high and the 50-DMA at around 1.2594/1.2600. Once cleared, the 100-DMA at 1.2634 would follow.
GBP/USD Price Action – Daily Chart
Forex News
Keep up with the financial markets, know what's happening and what is affecting the markets with our latest market updates. Analyze market movers, trends and build your trading strategies accordingly.