
Pound Sterling recovers against US Dollar on US recession fears
- The Pound Sterling rebounds against the US Dollar as traders have raised Fed dovish bets for the June meeting.
- The US-China trade war could lead the UK economy into a downturn.
- Fed Goolsbee stated that there is no generic answer to what the central bank should do to contain stagflation.
The Pound Sterling (GBP) bounces back to near 1.2800 against the US Dollar (USD) in Tuesday’s North American session from the monthly low of 1.2707 posted on Monday. The GBP/USD pair recovers as the US Dollar resumes its downside move after a short-lived recovery in the last two trading days. The US Dollar Index (DXY), which tracks the Greenback’s value against six major currencies, tumbles to near 103.00.
The Greenback remains on the backfoot as traders have become increasingly confident that the Federal Reserve (Fed) could reduce interest rates earlier this year to offset fears of potential United States (US) economic recession. According to the CME FedWatch tool, traders are almost certain that the central bank will resume its monetary policy easing cycle in the June policy meeting, which it paused in January.
The imposition of reciprocal tariffs by US President Donald Trump and fears of countermeasures by China and the Eurozone have stemmed the risks of a recession in the US. Investment banking firm Goldman Sachs has raised the probability of the US entering a recession to 45% from 35%, as anticipated last week.
The commentary from Fed officials has indicated that they are clueless about how protectionist policies by the President will shape the economic and the monetary policy outlook. Chicago Federal Reserve Bank President Austan Goolsbee said in an interview with CNN on Monday, "The anxiety is if these tariffs are as big as what are threatened on the US side, and if there’s massive retaliation, and then if there’s counter-retaliation again, it might send us back to the kind of conditions that we saw in 2021-22 when inflation was raging out of control," Reuters report.
Goolsbee added that our job is to look at the “hard data”, and if we have something that is called “stagflation,” then there is no “generic answer” to what the Fed should do “in response to that".
Meanwhile, investors look for fresh cues about how targeted nations will negotiate with Donald Trump on tariffs. During early North American trading hours, US Treasury Secretary Scott Bessent said in an interview with CNBC that the President will be personally involved in "negotiations". Bessent added, "If we're successful, the tariffs would be a melting ice cube in a way."
Daily digest market movers: Pound Sterling faces pressure on fears of US-China trade war
- The Pound Sterling underperforms its major peers on Tuesday as financial market participants expect Donald Trump’s tariffs-led fears of global economic slowdown could send the United Kingdom (UK) economy into a downturn.
- Market experts believe the trade war will be majorly between the US and China as the latter has announced retaliatory measures despite Trump’s warning his trading partners not to retaliate after imposing reciprocal tariffs on April 2. Though the Eurozone is also planning countermeasures in the face of a new suite of tariffs by Donald Trump, the region is still expected to negotiate humbly.
- A massive trade war between the US and China would result in the dumping of products by Chinese firms to other markets. Given the competitiveness of Chinese firms in manufacturing goods at cheaper rates compared to other nations, UK businesses would be incapable of competing against them in a pricing war. Such a scenario would lead to a sharp decline in UK business activity, which will be unfavorable for the Pound Sterling.
- With UK Prime Minister Keir Starmer already sensing the pricing war has vowed to protect domestic firms from the storm of Trump tariffs. "We stand ready to use industrial policy to help shelter British business from the storm," Starmer said over the weekend.
- Escalating fears of UK economic risks could also force Bank of England (BoE) officials to adopt an aggressive monetary policy easing approach this year. The BoE has cut interest rates in one of two policy meetings in 2025 and is expected to deliver two more this year.
- This week, the British currency will be influenced by the US Consumer Price Index (CPI) data for March and the monthly UK Gross Domestic Product (GDP) data for February, which will be released on Thursday and Friday, respectively.
British Pound PRICE Today
The table below shows the percentage change of British Pound (GBP) against listed major currencies today. British Pound was the strongest against the US Dollar.
| USD | EUR | GBP | JPY | CAD | AUD | NZD | CHF | |
|---|---|---|---|---|---|---|---|---|
| USD | -0.45% | -0.46% | -0.54% | -0.67% | -1.55% | -1.48% | -0.93% | |
| EUR | 0.45% | -0.06% | -0.16% | -0.24% | -1.10% | -1.00% | -0.50% | |
| GBP | 0.46% | 0.06% | -0.09% | -0.16% | -1.03% | -0.94% | -0.36% | |
| JPY | 0.54% | 0.16% | 0.09% | -0.12% | -0.98% | -0.96% | -0.33% | |
| CAD | 0.67% | 0.24% | 0.16% | 0.12% | -0.89% | -0.79% | -0.20% | |
| AUD | 1.55% | 1.10% | 1.03% | 0.98% | 0.89% | 0.09% | 0.68% | |
| NZD | 1.48% | 1.00% | 0.94% | 0.96% | 0.79% | -0.09% | 0.59% | |
| CHF | 0.93% | 0.50% | 0.36% | 0.33% | 0.20% | -0.68% | -0.59% |
The heat map shows percentage changes of major currencies against each other. The base currency is picked from the left column, while the quote currency is picked from the top row. For example, if you pick the British Pound from the left column and move along the horizontal line to the US Dollar, the percentage change displayed in the box will represent GBP (base)/USD (quote).
Technical Analysis: Pound Sterling stives to gain ground above 1.2700
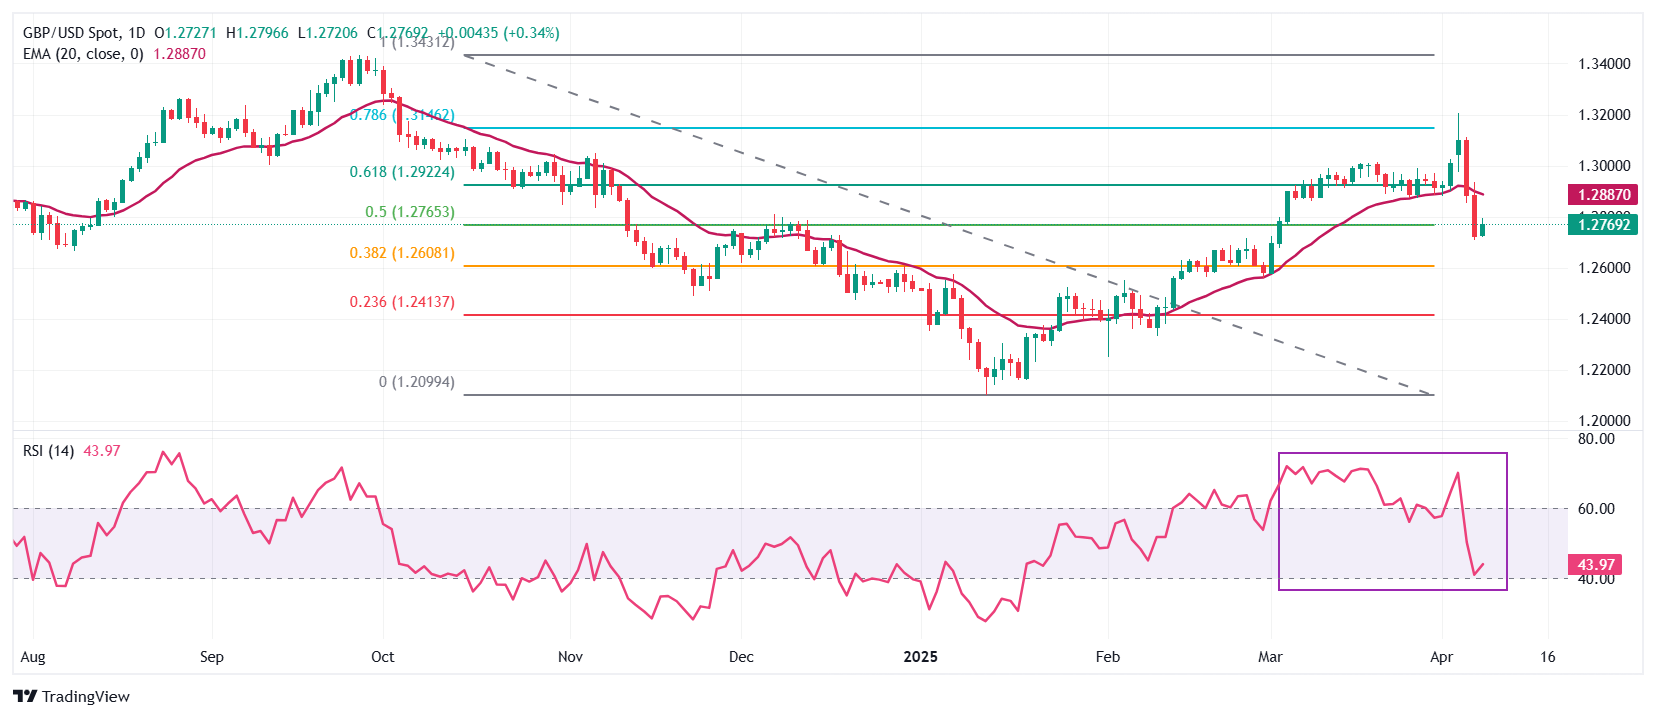
The Pound Sterling looks to gain ground above 1.2700 against the US Dollar on Tuesday after facing intense selling pressure in the last two trading days. The GBP/USD pair trades below the 20-day Exponential Moving Average (EMA), which is around 1.2887, suggesting that the near-term trend is bearish.
The 14-day Relative Strength Index (RSI) falls to near 40.00. A fresh bearish momentum could be triggered if the RSI fails to hold the 40.00 level.
Looking down, the 38.2% Fibonacci retracement plotted from late September high to mid-January low, near 1.2600, will act as a key support zone for the pair. On the upside, the psychological figure of 1.3000 will act as a key resistance zone.
Economic Indicator
Gross Domestic Product (MoM)
The Gross Domestic Product (GDP), released by the Office for National Statistics on a monthly and quarterly basis, is a measure of the total value of all goods and services produced in the UK during a given period. The GDP is considered as the main measure of UK economic activity. The MoM reading compares economic activity in the reference month to the previous month. Generally, a rise in this indicator is bullish for the Pound Sterling (GBP), while a low reading is seen as bearish.
Read more.Next release: Fri Apr 11, 2025 06:00
Frequency: Monthly
Consensus: 0.1%
Previous: -0.1%
Source: Office for National Statistics
Forex News
Keep up with the financial markets, know what's happening and what is affecting the markets with our latest market updates. Analyze market movers, trends and build your trading strategies accordingly.