
NZD/USD Price Analysis: Bulls struggle with 20-day SMA resistance
- NZD/USD loses momentum, gets rejected by the 20-day SMA.
- Bulls struggle to claim control and get stuck in the 0.6070-0.6100 channel.
- Indicators paint a neutral to bearish picture on the daily chart.
In Monday's trading session, the NZD/USD showed weakened momentum, declining by 0.60% to 0.6080. Buyers found the 20-day Simple Moving Average (SMA) at around 0.6100, a strong resistance that quickly rejected the bullish force.
Daily technical indicators reflect a cautionary scenario for bullish traders. The Relative Strength Index (RSI) is currently at 46, a decrease from above 50 levels and now placing it in negative zone. This dip represents a decrease in buying pressure. On the contrary, the Moving Average Convergence Divergence (MACD) presents flat red bars, suggesting a somewhat stagnant bearish momentum.
NZD/USD daily chart
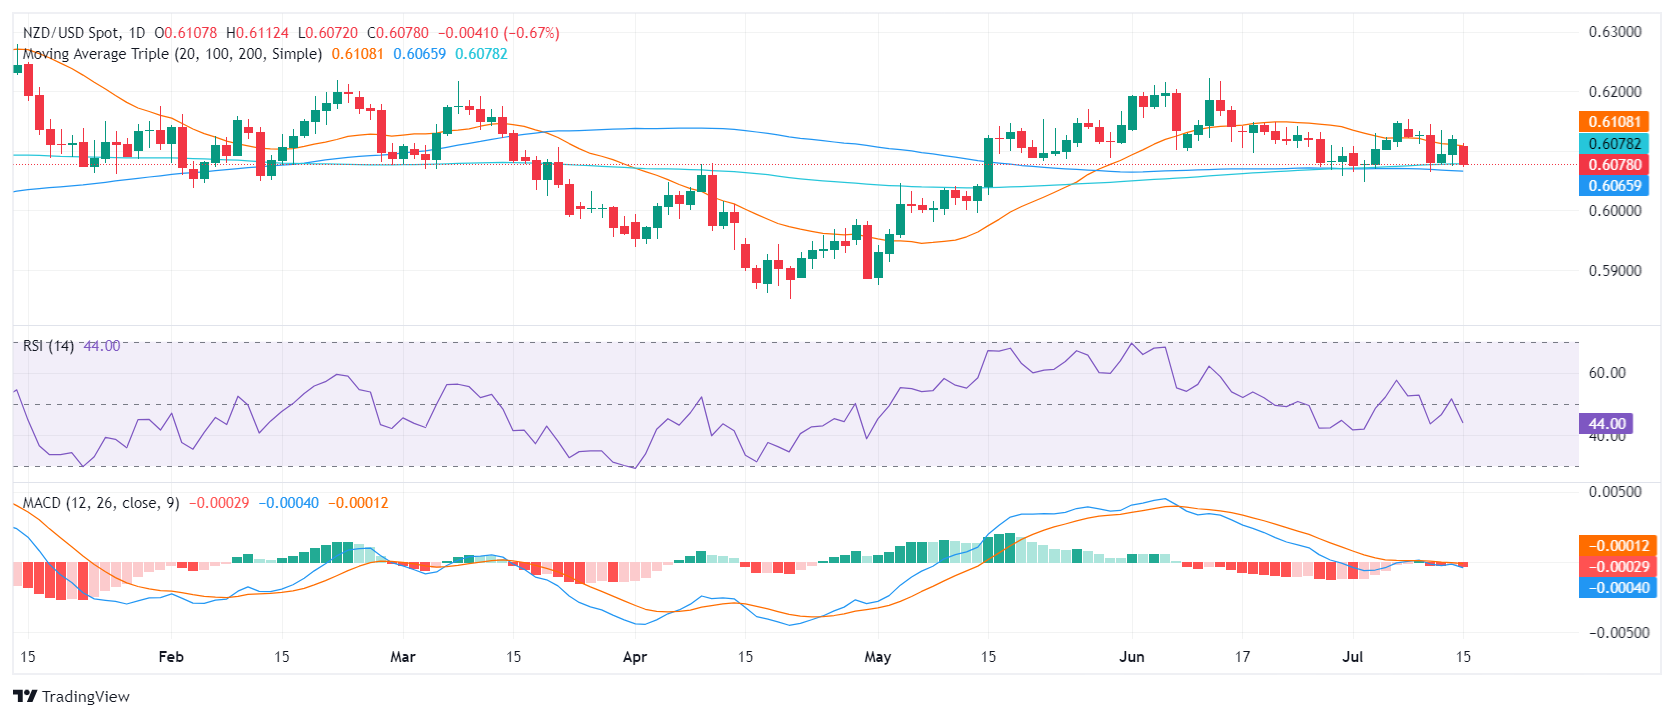
The bulls have got their work cut out as they face resistance at 0.6100 around the 20-day SMA, followed by the higher barriers at 0.6150 and 0.6200. A convincing close above these levels would be necessary to enforce bullish control and steer the focus northwards.
On the flip side, the 0.6070 mark acts as a staunch support, holding the line in the face of downward pressure, being closely trailed by further support lines at 0.6050 and 0.6030. A decisive plunge below these levels would indicate a shift back to a bearish perspective, potentially paving the way for a correction toward even lower levels.
Forex News
Keep up with the financial markets, know what's happening and what is affecting the markets with our latest market updates. Analyze market movers, trends and build your trading strategies accordingly.