Australian Dollar declines after dovish comments from RBA Deputy Governor Hauser
- The Australian Dollar loses ground as RBA Deputy Governor Hauser advises against formulating policy based on a single inflation report.
- Australia’s high inflation has fueled speculation that the RBA might raise interest rates again in August.
- The US Dollar appreciates due to higher yields ahead of Friday’s release of Core PCE inflation.
The Australian Dollar (AUD) depreciates against the US Dollar (USD) on Friday, which could be attributed to the dovish comments from the Reserve Bank of Australia’s (RBA) Deputy Governor Andrew Hauser. Hauser said it would be a “bad mistake” to formulate policy in response to a single inflation report. He emphasized that there is still a suite of economic data to come that will require detailed analysis, per Bloomberg.
The AUD gained ground after releasing May's higher-than-expected Monthly Consumer Price Index (CPI). The persistently high inflation has fueled speculation that the RBA might raise interest rates again in August.
The US Dollar (USD) gains ground due to higher yields on US Treasury bonds. Friday’s Core PCE Price Index inflation is projected to decrease YoY to 2.6% from the previous 2.8%. This data is seen as the Federal Reserve's (Fed) preferred inflation gauge.
Daily Digest Market Movers: Australian Dollar declines due to hawkish Fedspeak
- Australia’s 10-year government bond yield surged above 4.4%, reaching a three-week high, as a hot inflation reading fueled fears that the Reserve Bank of Australia might raise interest rates again in the next meeting in August.
- Federal Reserve (Fed) Board of Governors member Michelle Bowman noted on Thursday that she is still not ready to support a central bank rate cut with inflation pressures still elevated. Bowman said, adding “We are still not yet at the point where it is appropriate to lower the policy rate, and I continue to see a number of upside risks to inflation,” per Reuters.
- US Gross Domestic Product Annualized expanded by 1.4% in Q1, slightly higher than the previous reading of 1.3%, but continuing to point to the lowest growth since the contractions in the first half of 2022.
- US Initial Jobless Claims showed on Thursday that the number of people claiming unemployment benefits fell to 233,000 in the week ending June 21, below market expectations of 236,000. The claim count fell for a second consecutive week since hitting the 10-month high of 243,000 earlier in June.
- The first US presidential debate between President Joe Biden and Republican Presidential Nominee Donald Trump began on CNN News. Biden acknowledged that “inflation had driven prices substantially higher than at the start of his term but said he deserves credit for putting 'things back together again' following the coronavirus pandemic.” In response, Trump condemned elevated inflation levels. He suggested that tariffs would decrease deficits and urged scrutiny of countries like China, per Reuters.
- Reserve Bank of Australia (RBA) Assistant Governor Christopher Kent stated on Wednesday that recent data emphasize the necessity of remaining vigilant about potential inflation increases. Kent noted that current policies are contributing to slower demand growth and lower inflation. He also mentioned that no options regarding future interest rate adjustments are being excluded, per Bloomberg.
- Australia’s monthly Consumer Price Index (CPI) jumped by 4.0% in the year to May, up from the 3.6% increase recorded in April, according to data published by the Australian Bureau of Statistics (ABS) on Wednesday. This increase exceeded the market forecast, which predicted a 3.8% growth for the reported period.
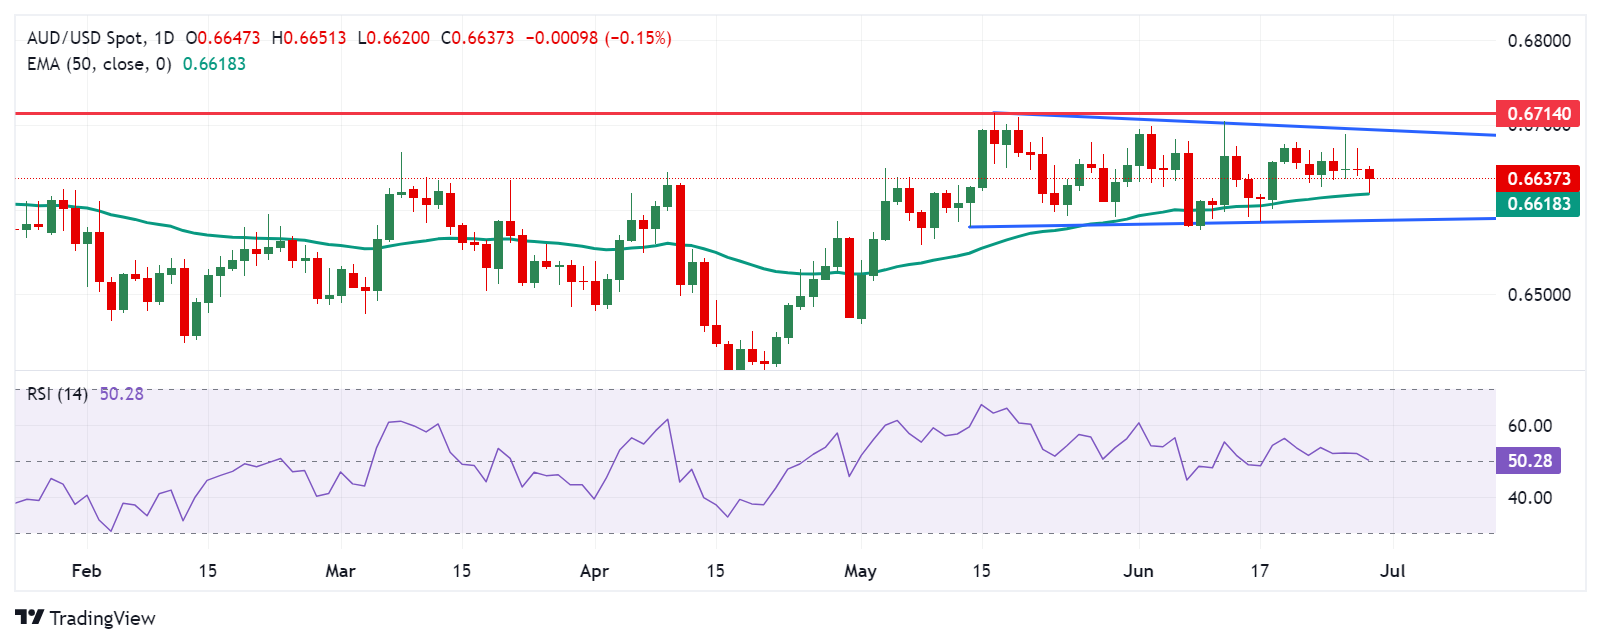
Technical Analysis: Australian Dollar falls below 0.6650
The Australian Dollar trades around 0.6630 on Friday. The daily chart analysis indicates a neutral bias for the AUD/USD pair as it consolidates within a rectangle formation. The 14-day Relative Strength Index (RSI) is at the 50 level, also suggesting neutral momentum. Further movement may signal a clear directional trend.
The AUD/USD pair finds support around the 50-day Exponential Moving Average (EMA) at 0.6618. A break below this level could lead the pair to test the lower boundary of the rectangle formation near 0.6585.
On the upside, the AUD/USD pair may face resistance near the upper boundary of the rectangle formation around 0.6695, close to the psychological level of 0.6700. Further resistance appears at 0.6714, the highest level since January.
AUD/USD: Daily Chart
Australian Dollar PRICE Today
The table below shows the percentage change of Australian Dollar (AUD) against listed major currencies today. Australian Dollar was the weakest against the Japanese Yen.
| USD | EUR | GBP | JPY | CAD | AUD | NZD | CHF | |
|---|---|---|---|---|---|---|---|---|
| USD | 0.08% | -0.00% | -0.02% | 0.03% | 0.00% | 0.15% | 0.10% | |
| EUR | -0.08% | -0.08% | -0.12% | -0.05% | -0.09% | 0.07% | 0.03% | |
| GBP | 0.00% | 0.08% | -0.04% | 0.01% | -0.01% | 0.14% | 0.08% | |
| JPY | 0.02% | 0.12% | 0.04% | 0.03% | 0.01% | 0.16% | 0.13% | |
| CAD | -0.03% | 0.05% | -0.01% | -0.03% | -0.04% | 0.12% | 0.05% | |
| AUD | -0.00% | 0.09% | 0.01% | -0.01% | 0.04% | 0.16% | 0.09% | |
| NZD | -0.15% | -0.07% | -0.14% | -0.16% | -0.12% | -0.16% | -0.07% | |
| CHF | -0.10% | -0.03% | -0.08% | -0.13% | -0.05% | -0.09% | 0.07% |
The heat map shows percentage changes of major currencies against each other. The base currency is picked from the left column, while the quote currency is picked from the top row. For example, if you pick the Australian Dollar from the left column and move along the horizontal line to the US Dollar, the percentage change displayed in the box will represent AUD (base)/USD (quote).
Economic Indicator
Core Personal Consumption Expenditures - Price Index (MoM)
The Core Personal Consumption Expenditures (PCE), released by the US Bureau of Economic Analysis on a monthly basis, measures the changes in the prices of goods and services purchased by consumers in the United States (US). The PCE Price Index is also the Federal Reserve’s (Fed) preferred gauge of inflation. The MoM figure compares the prices of goods in the reference month to the previous month.The core reading excludes the so-called more volatile food and energy components to give a more accurate measurement of price pressures. Generally, a high reading is bullish for the US Dollar (USD), while a low reading is bearish.
Read more.Next release: Fri Jun 28, 2024 12:30
Frequency: Monthly
Consensus: 0.1%
Previous: 0.2%
Source: US Bureau of Economic Analysis
After publishing the GDP report, the US Bureau of Economic Analysis releases the Personal Consumption Expenditures (PCE) Price Index data alongside the monthly changes in Personal Spending and Personal Income. FOMC policymakers use the annual Core PCE Price Index, which excludes volatile food and energy prices, as their primary gauge of inflation. A stronger-than-expected reading could help the USD outperform its rivals as it would hint at a possible hawkish shift in the Fed’s forward guidance and vice versa.
Forex News
Keep up with the financial markets, know what's happening and what is affecting the markets with our latest market updates. Analyze market movers, trends and build your trading strategies accordingly.