Gold trades higher as central banks move to cut interest rates
- Gold price rises as central banks either cut or signal a willingness to cut interest rates, reducing Gold's "opportunity-cost".
- Other bullish drivers include incresing geopolitical tensions and a rebound in Chinese trade data.
- The World Gold Council publishes its monthly report, highlighting Asian demand and central-bank buying.
- Gold pulls back from resistance and returns to trading within a developing range.
Gold price (XAU/USD) is trading higher on Thursday, exchanging hands at around $2,320, after several major central banks either decided to cut interest rates or signalled a greater willingness to cut them in the future. Lower interest rates reduce the "opportunity cost" of holding Gold which is a non-interest-yielding asset, making it more attractive as an investment.
A stalemate in ceasefire talks between Israel and Hamas after Israel’s continued incursions into Rafah, and reports of a worsening situation on the frontline for Ukraine add further upside pressure from geopolitical risk, which benefits Gold as a safe-haven.
Gold rises as global central banks finally move ahead with lowering interest rates
Gold price is rising as central banks around the world start cutting interest rates after keeping them high for several years to fight inflation.
In Sweden the Riksbank made the move to cut interest rates by 0.25% to 3.75% for the first time since 2016 and in the UK, the Bank of England (BoE) voted by a narrower 7-2 margin to keep rates unchanged instead of cutting them. This was one vote more than the 8-1 of the previous meeting, showing an increased willingness on the part of policymakers to entertain rate cuts.
Furthermore, The Swiss National Bank (SNB) was the first major central bank to cut its interest rates at its March meeting, and the Reserve Bank of Australia (RBA) made a dovish hold which suprised markets at its last policy meeting. In addition, the European Central Bank (ECB) has all but guaranteed it will go ahead with an interest-rate cut in June.
Gold price rises on China data, outlook for demand
Gold price also saw gains on Thursday after Chinese trade data showed a greater-than-expected rise in Chinese exports of 1.5% year-over-year in April, rebounding from a 7.5% drop a month earlier.
According to the data, imports rose 8.4%, beating the 5.4% forecast and the previous 1.9% drop. China is a key player in the global market for Gold so strong economic data from the country impacts its valuation.
World Gold Council highlights Asian and central-bank demand
East Asian demand was a factor highlighted by the World Gold Council (WGC), a respected barometer of the global Gold market, in its latest report regarding the Gold market in April and the outlook for the future.
The WGC report noted that whilst Indian demand fell and the Gold futures market showed flatlining uptake, Chinese demand and US ETF flows turned positive, “joining strong demand for Asian ETFs.”
The importance of central banks as key buyers was highlighted, as was geopolitical risk.
“Gold hit new all-time highs in April but pulled back by month-end: Chinese buying and central banks appear to be major drivers of support,” according to the report.
Regarding the outlook, WGC stated that “Stagflation risks are on the rise: growth looks fragile while inflation remains problematic. Asian investors may continue to draw attention.”
US outlook could cap upside
Gold price may struggle to gain traction, however, as the US Federal Reserve (Fed) stands out as the one major central bank not yet ready to cut interest rates. The divergent stance of the Fed compared to other central banks is also strengthening the US Dollar (USD) creating another headwind for the USD-denominated Gold price.
Although last week’s US Nonfarm Payrolls data showed a weakening in the US labor market that suggested the Federal Reserve (Fed) might cut interest rates sooner than had been anticipated, commentary from Fed officials since, shows a continued reluctance to lower interest rates.
On Wednesday, Boston Fed President Susan Collins said it looked like inflation would take “longer than previously thought” to come back down, suggesting that the Fed would need to keep interest rates restrictively high for longer.
Meanwhile, Minneapolis Fed President Neel Kashkari said interest rates would likely have to remain at current levels for an “extended period” in order to beat inflation back down.
A market-based gauge of the probabilities of future interest rate decisions by the Fed, the CME FedWatch tool, meanwhile, places the odds of rate cuts in September or earlier at 65% (down from 85% a week ago) and 78% in November. The probabilities in November had previously been almost 100%.
Technical Analysis: Gold price pulls back from resistance at top of range
Gold price (XAU/USD) has retested and pulled back from the ceiling of a mini-range at around $2,326. It is currently finding support from both the 200 and 50 Simple Moving Average (SMA) on the 4-hour chart, in the $2,310s.
XAU/USD 4-hour Chart
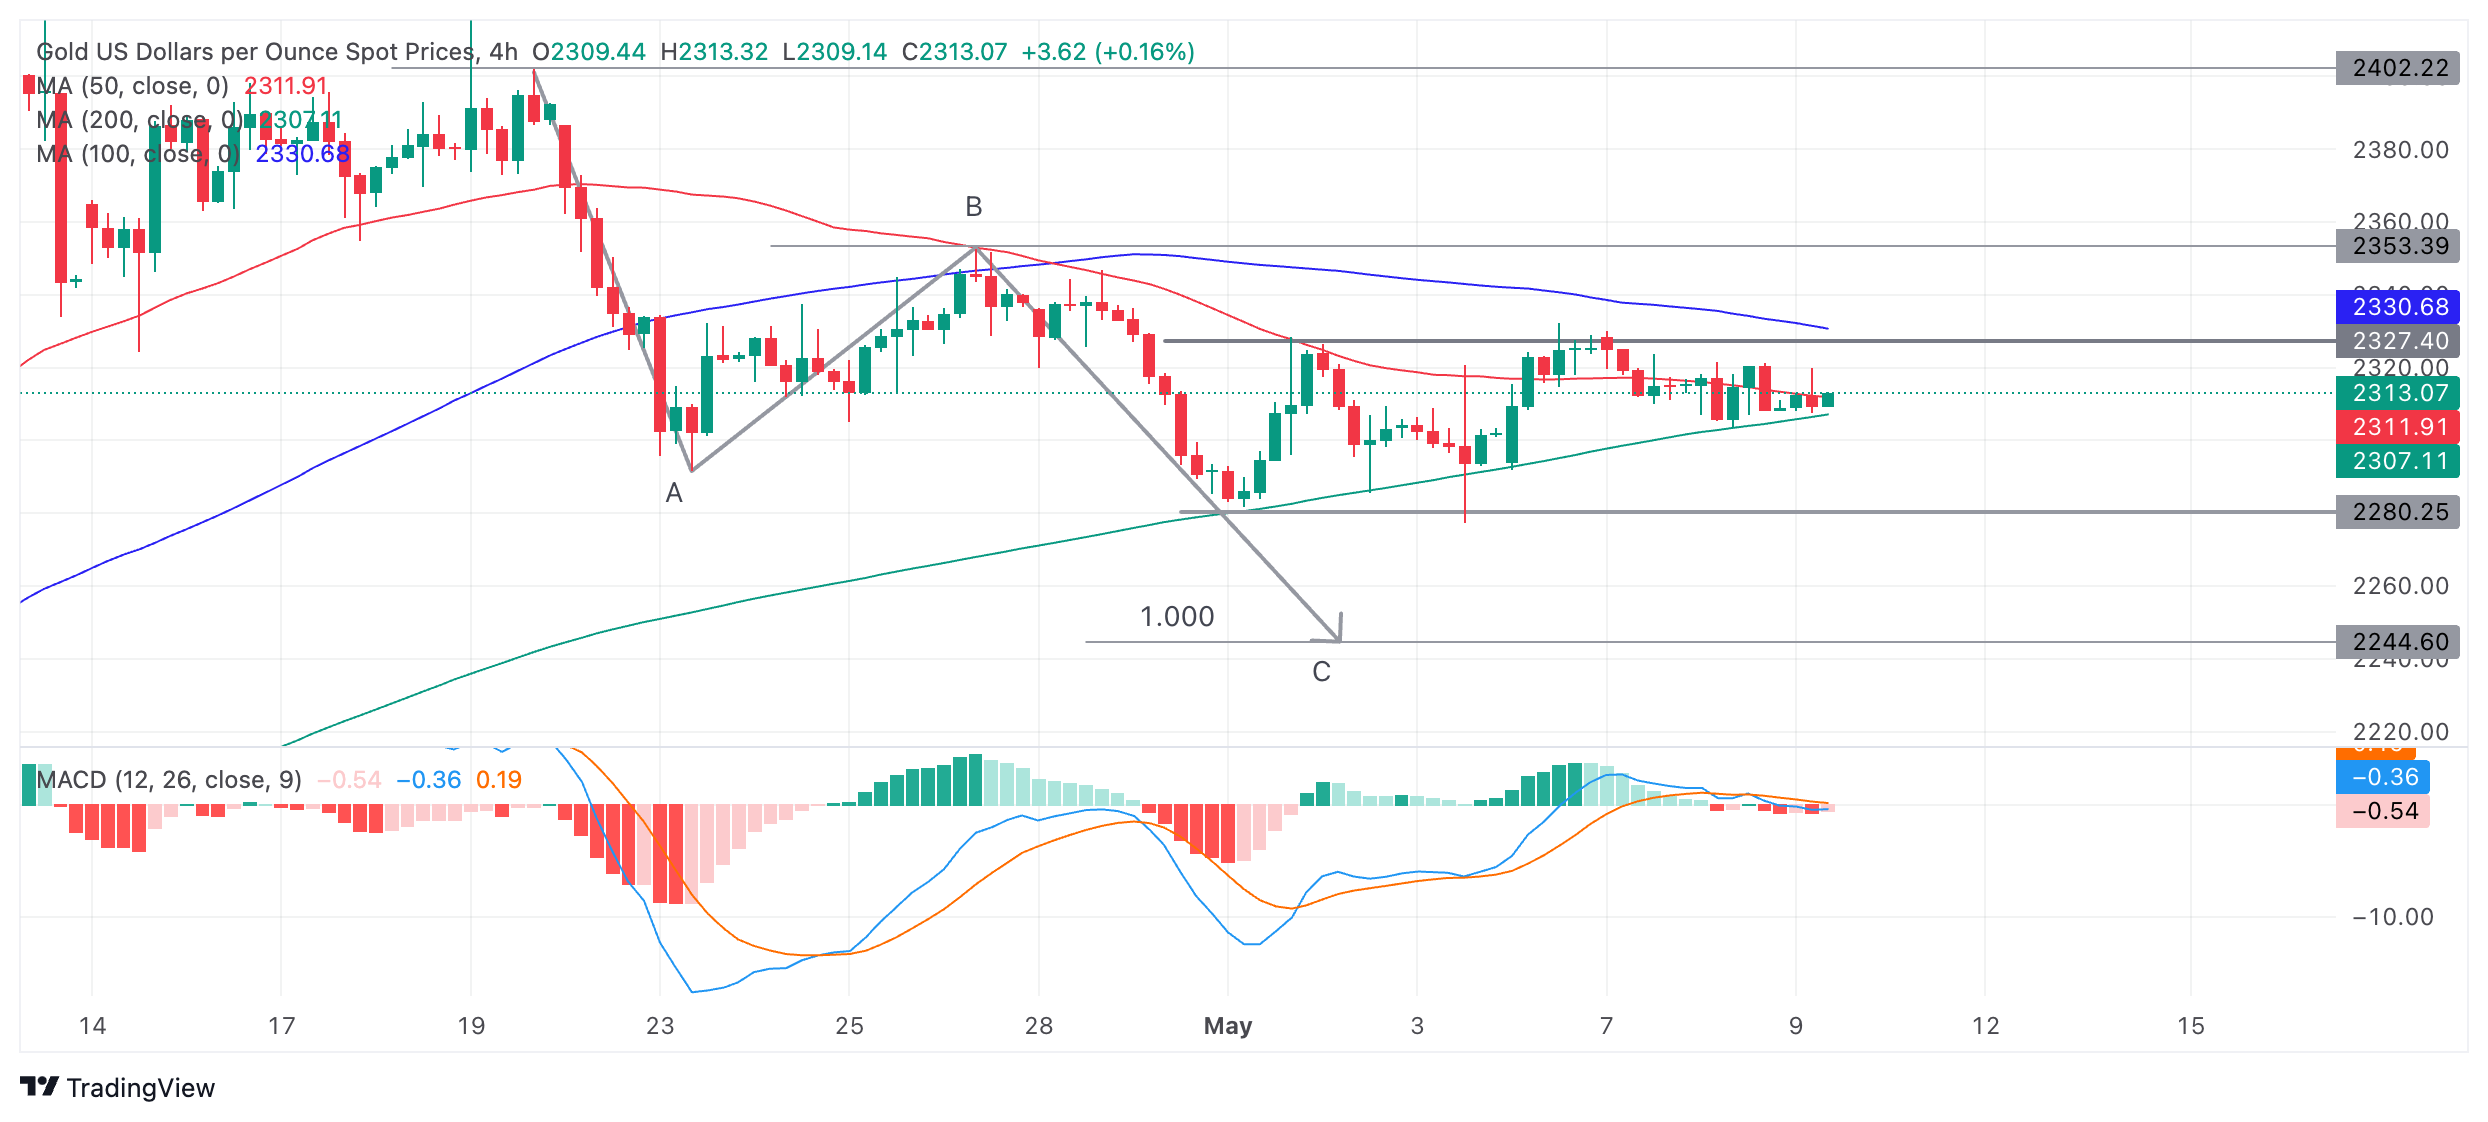
The Moving Average Convergence Divergence (MACD) indicator is mildly negative, painting red bars on the histogram. Further, the MACD line has crossed below the signal line, giving a sell signal.
Price could potentially fall back down to the base of the range at around $2,280.
The bullish Gold price trend on both the medium and long-term charts (daily and weekly), overall add a supportive backdrop.
As such, a decisive break out of the top of the range would signal a likely move up to a conservative target at $2,353 – the top of wave B and the 0.681 Fibonacci extension of the height of the range extrapolated higher. In a bullish case, it could even possibly hit $2,370.
A decisive break would be one characterized by a longer-than-average green candlestick that pierces above the range ceiling, and closes near its high; or three green candlesticks in a row that pierce above the respective level.
Measured Move, unfinished business
Gold price is potentially still in the middle of unfolding a bearish Measured Move price pattern which began on April 19.
Measured Moves are zig-zag type patterns composed of three waves labeled A, B and C, with C usually equalling the length of A or a Fibonnaci 0.681 of A. Price has fallen to the conservative estimate for wave C at $2,286, the Fibonacci 0.681 of wave A.
Wave C could still go lower, however, and reach the 100% extrapolation of A at $2,245. Such a move would be confirmed by a decisive break below the range and the May 3 low at $2,277.
Interest rates FAQs
Interest rates are charged by financial institutions on loans to borrowers and are paid as interest to savers and depositors. They are influenced by base lending rates, which are set by central banks in response to changes in the economy. Central banks normally have a mandate to ensure price stability, which in most cases means targeting a core inflation rate of around 2%. If inflation falls below target the central bank may cut base lending rates, with a view to stimulating lending and boosting the economy. If inflation rises substantially above 2% it normally results in the central bank raising base lending rates in an attempt to lower inflation.
Higher interest rates generally help strengthen a country’s currency as they make it a more attractive place for global investors to park their money.
Higher interest rates overall weigh on the price of Gold because they increase the opportunity cost of holding Gold instead of investing in an interest-bearing asset or placing cash in the bank. If interest rates are high that usually pushes up the price of the US Dollar (USD), and since Gold is priced in Dollars, this has the effect of lowering the price of Gold.
The Fed funds rate is the overnight rate at which US banks lend to each other. It is the oft-quoted headline rate set by the Federal Reserve at its FOMC meetings. It is set as a range, for example 4.75%-5.00%, though the upper limit (in that case 5.00%) is the quoted figure. Market expectations for future Fed funds rate are tracked by the CME FedWatch tool, which shapes how many financial markets behave in anticipation of future Federal Reserve monetary policy decisions.
Forex News
Keep up with the financial markets, know what's happening and what is affecting the markets with our latest market updates. Analyze market movers, trends and build your trading strategies accordingly.