
USD/CHF Price Analysis: Bears moved in as ‘evening star’ pattern looms
- USD/CHF falls 0.16%, trading below 0.9100 due to broader US dollar weakness.
- Technicals show neutral to upward bias; recent bearish RSI indicates loss of upward momentum.
- Key support at 0.9006 (50-day MA and support trendline); resistance at 0.9100 and 0.9174.
The USD/CHF extended its losses for two straight days and is down some 0.16%, courtesy of broad US Dollar weakness, undermined by lower US Treasury yields. The major trades at 0.9064 after hitting a high shy of 0.9100.
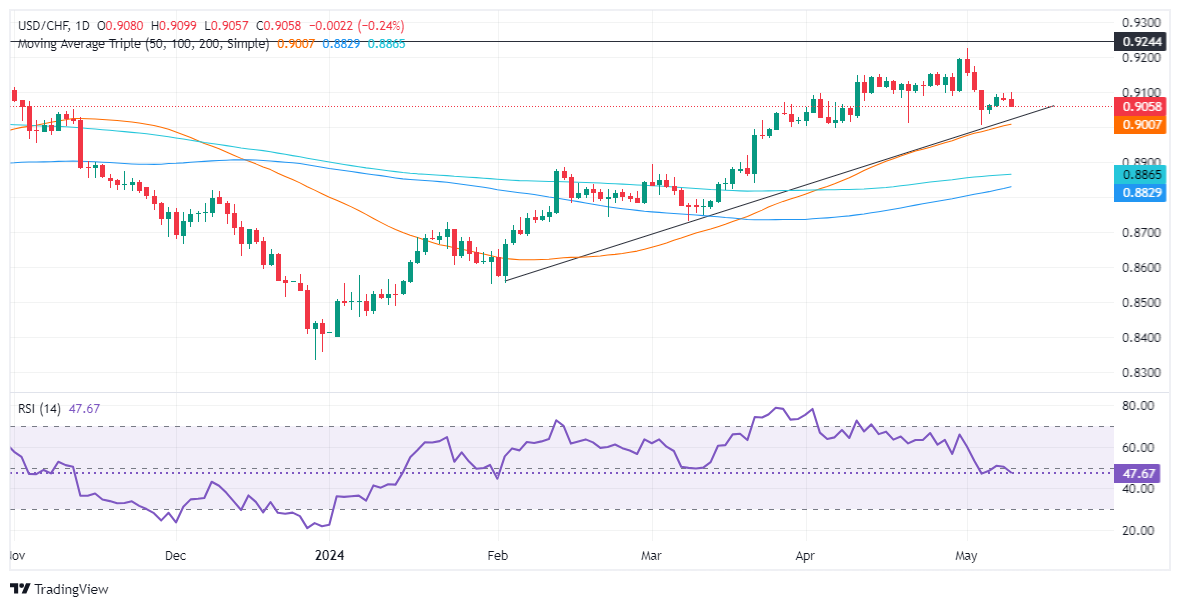
USD/CHF Price Analysis: Technical outlook
The daily chart depicts the USD/CHF as neutral to upward biased, despite buyers losing momentum, as shown by the Relative Strength Index (RSI) shifting bearish. Although the pair has lost some 1.80% after hitting a year-to-date (YTD) high of 0.9224, solid support seen at the confluence of the 50-day moving average and a support trendline at around 0.9006/30 might cap the pair’s drop.
Looking at the potential for a bullish continuation, the USD/CHF could see a positive turn if it manages to climb above 0.9100. Once this level is breached, the next immediate resistance level to watch out for would be May 2 high at 0.9174, with a further test at 0.9200.
On the other hand, if bears push prices below 0.9000, that will confirm the ‘evening star’ chart pattern and exacerbate a drop toward the 200-DMA at 0.8887, ahead of the 100-DMA at 0.8829.
USD/CHF Price Action – Daily Chart
Forex News
Keep up with the financial markets, know what's happening and what is affecting the markets with our latest market updates. Analyze market movers, trends and build your trading strategies accordingly.