
Japanese Yen trims part of modest intraday gains; up a little against broadly weaker USD
- The Japanese Yen attracts buyers for the second straight day amid reviving safe-haven demand.
- A modest USD downtick drags USD/JPY further away from a multi-week high touched on Friday.
- The BoJ’s dovish pause might cap JPY gains as the focus shifts to the FOMC meeting this week.
The Japanese Yen (JPY) trims a part of its modest intraday gains heading into the European session on Monday and assists the USD/JPY pair to recover a few pips from sub-144.00 levels. The Bank of Japan's (BoJ) dovish pause last Thursday turns out to be a key factor that holds back the JPY bulls from placing aggressive bets. However, the uncertainty over US President Donald Trump's tariffs and renewed geopolitical risks continue to underpin the safe-haven JPY for the second straight day.
The US Dollar (USD), on the other hand, remains depressed below a multi-week low amid heightened economic uncertainty on the back of Trump's erratic trade policies. This might further contribute to capping any meaningful appreciating move for the USD/JPY pair. Investors might also opt to wait on the sidelines ahead of the crucial two-day FOMC policy meeting starting on Tuesday. In the meantime, the US ISM Services PMI will be looked upon for short-term opportunities later today.
Japanese Yen bulls seem non committed as BoJ's dovish outlook overshadows reviving safe-haven demand
- China said last week it was evaluating the possibility of trade talks with the US, fueling hopes for the potential de-escalation of tensions between the world's two largest economies. US President Donald Trump announced on Sunday a 100% tariff on all foreign-produced movies.
- Israeli Prime Minister Benjamin Netanyahu vowed to retaliate against Yemen's Iran-aligned Houthi rebels firing a missile that landed near the Ben-Gurion Airport. In response, Iran’s Defence Minister Aziz Nasirzadeh said that Tehran would strike back if the US or Israel attacked.
- Russian President Vladimir Putin said in remarks published on Sunday that Russia had sufficient strength and resources to take the war in Ukraine to its logical conclusion. This keeps the geopolitical risk in play and drives safe-haven flows toward the Japanese Yen on Monday.
- The Bank of Japan surprised with dovish guidance last Thursday and forced investors to scale back their bets for a rate hike in June or July. However, the broadening inflation in Japan and prospects of sustained wage hikes keep the door open for further policy tightening by the BoJ.
- The US Dollar struggles to capitalize on Friday's modest bounce that followed the upbeat US jobs data, which showed that the economy added 177K new jobs in April against 130K expected. Other details of the report showed that the Unemployment Rate remained unchanged at 4.2.
- The data pointed to a still resilient US labor market despite heightened economic uncertainty on the back of Trump's tariffs and concerns about renewed price pressures. Traders pushed back their expectations about the resumption of the Federal Reserve's rate-cutting cycle to July from June.
- This, however, still marks a big divergence in comparison to expectations for additional rate hikes by the BoJ in 2025 and should act as a tailwind for the lower-yielding JPY. The market focus now shifts to a two-day FOMC monetary policy meeting starting on Tuesday.
USD/JPY shows resilience below the 144.00 mark; 143.75-143.70 holds the key for bullish traders
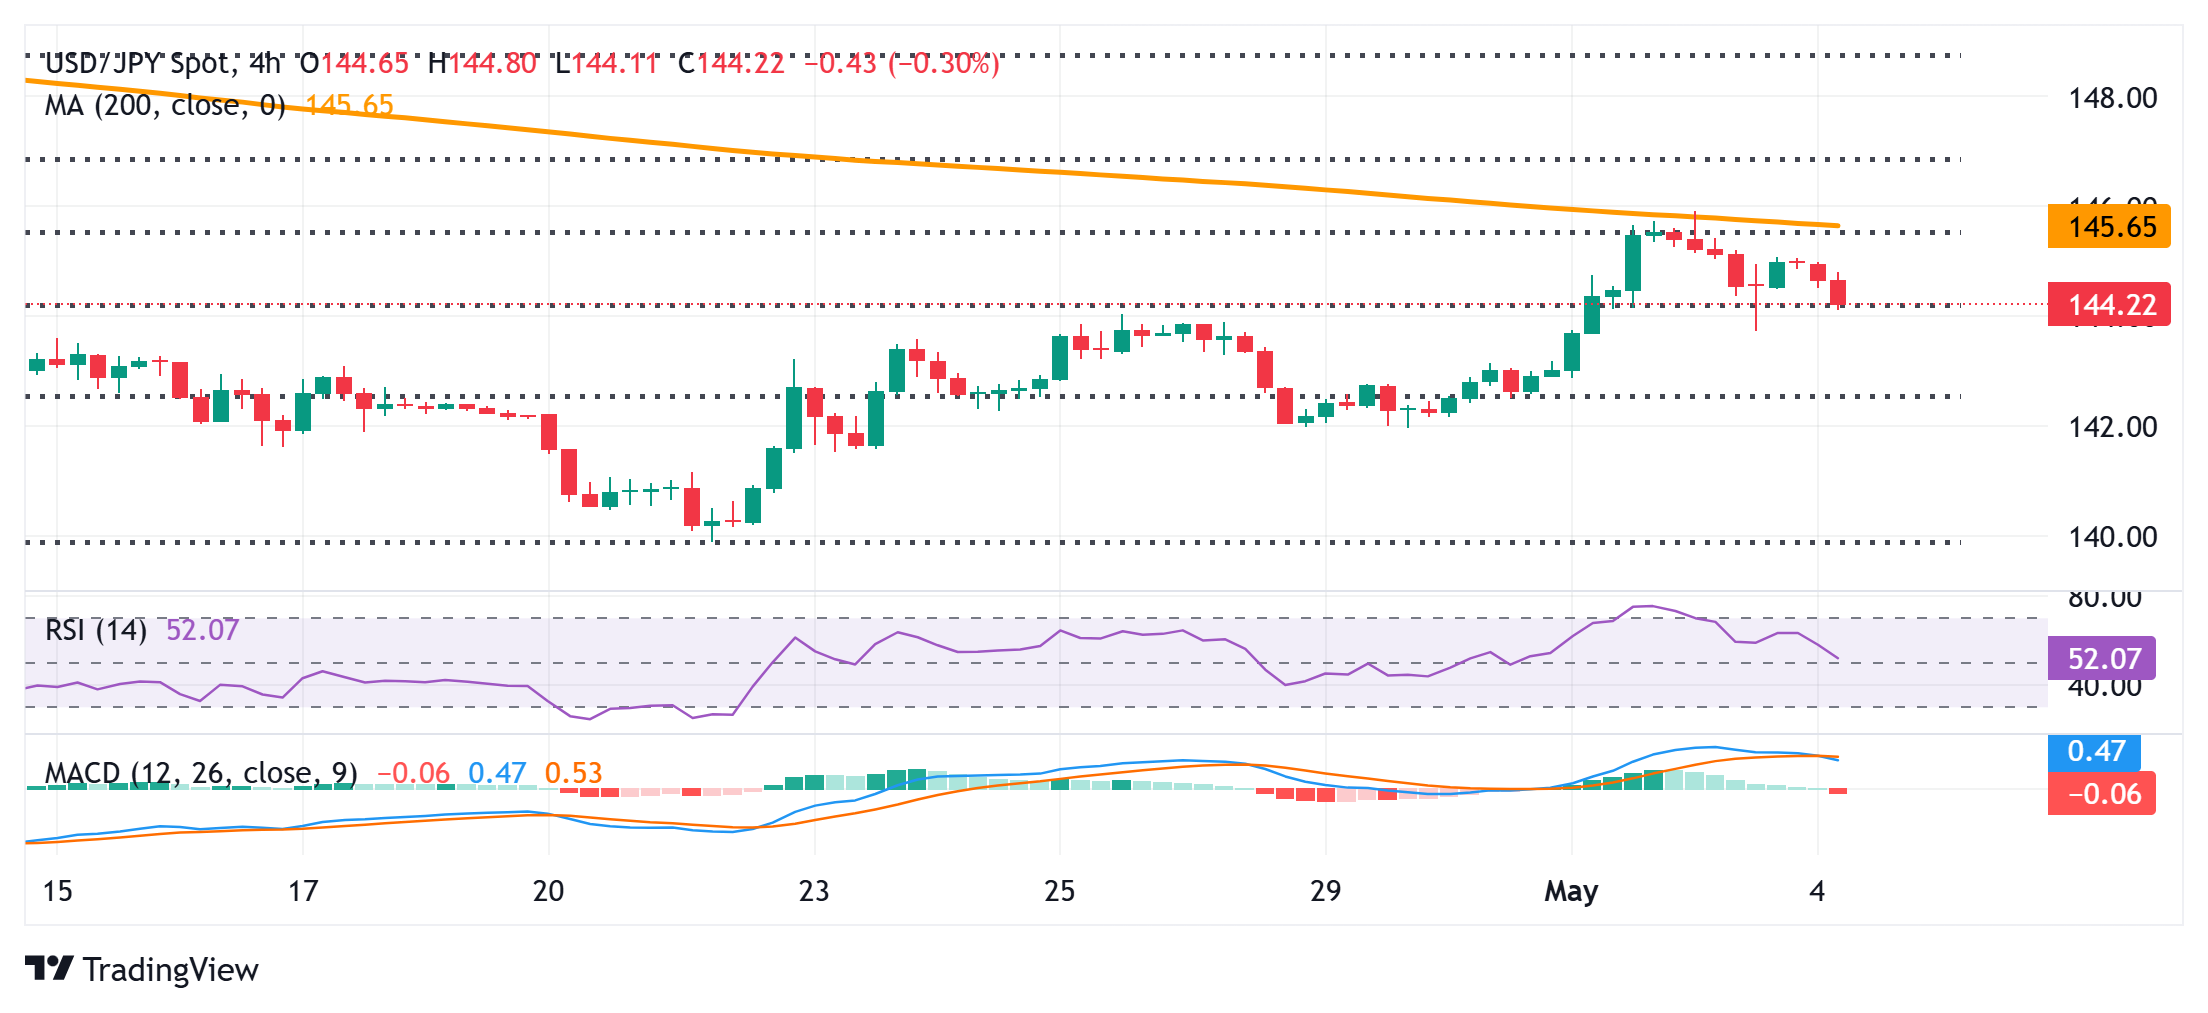
From a technical perspective, the USD/JPY pair last week struggled to find acceptance above the 50% Fibonacci retracement level of the March-April downfall and faced rejection near the 200-period Simple Moving Average (SMA) on the 4-hour chart. This makes it prudent to wait for some follow-through buying beyond the 146.00 mark before positioning for an extension of the recent goodish recovery move from a multi-month low. Spot prices might then climb to the 146.55-146.60 intermediate resistance before aiming to test the 61.8% Fibo. level, around the 147.00 neighborhood.
Meanwhile, oscillators on the daily chart still hold in positive territory, suggesting that any subsequent fall below the 144.00 mark might still be seen as a buying opportunity. This should help limit the downside near Friday's swing low, around the 143.75-143.70 region, which if broken could make the USD/JPY pair vulnerable. The subsequent slide could drag spot prices to the 143.30 intermediate support en route to the 143.00 round figure and the 23.6% Fibo., around the 142.65 region.
US Dollar PRICE Today
The table below shows the percentage change of US Dollar (USD) against listed major currencies today. US Dollar was the strongest against the Canadian Dollar.
| USD | EUR | GBP | JPY | CAD | AUD | NZD | CHF | |
|---|---|---|---|---|---|---|---|---|
| USD | 0.12% | -0.11% | -0.25% | 0.13% | -0.17% | -0.32% | 0.12% | |
| EUR | -0.12% | 0.04% | -0.08% | 0.28% | -0.02% | -0.17% | 0.27% | |
| GBP | 0.11% | -0.04% | -0.36% | 0.24% | -0.06% | -0.21% | 0.23% | |
| JPY | 0.25% | 0.08% | 0.36% | 0.35% | 0.06% | -0.01% | 0.45% | |
| CAD | -0.13% | -0.28% | -0.24% | -0.35% | -0.60% | -0.45% | -0.01% | |
| AUD | 0.17% | 0.02% | 0.06% | -0.06% | 0.60% | -0.15% | 0.29% | |
| NZD | 0.32% | 0.17% | 0.21% | 0.01% | 0.45% | 0.15% | 0.43% | |
| CHF | -0.12% | -0.27% | -0.23% | -0.45% | 0.00% | -0.29% | -0.43% |
The heat map shows percentage changes of major currencies against each other. The base currency is picked from the left column, while the quote currency is picked from the top row. For example, if you pick the US Dollar from the left column and move along the horizontal line to the Japanese Yen, the percentage change displayed in the box will represent USD (base)/JPY (quote).
Forex News
Keep up with the financial markets, know what's happening and what is affecting the markets with our latest market updates. Analyze market movers, trends and build your trading strategies accordingly.