
NZD/USD Price Analysis: Bullish swing in motion, bearish upturn still possible
- The daily RSI and MACD show a growing bullish momentum.
- The hourly chart RSI reveals a possible slowdown in growing buying traction.
- The NZD/USD still lags behind other main SMAs, potentially pointing to a long-term bearish prospect.
The NZD/USD pair is seen exhibiting a minor decline, dropping towards the 0.6000 level in Monday's session. The market pattern appears to be dominated by a bullish swing, suggesting an increase in buyer control. Despite this, the possibility of bearish movements remains, as the key Simple Moving Averages (SMAs) and shifting investor sentiment indicate that the bulls need further validation.
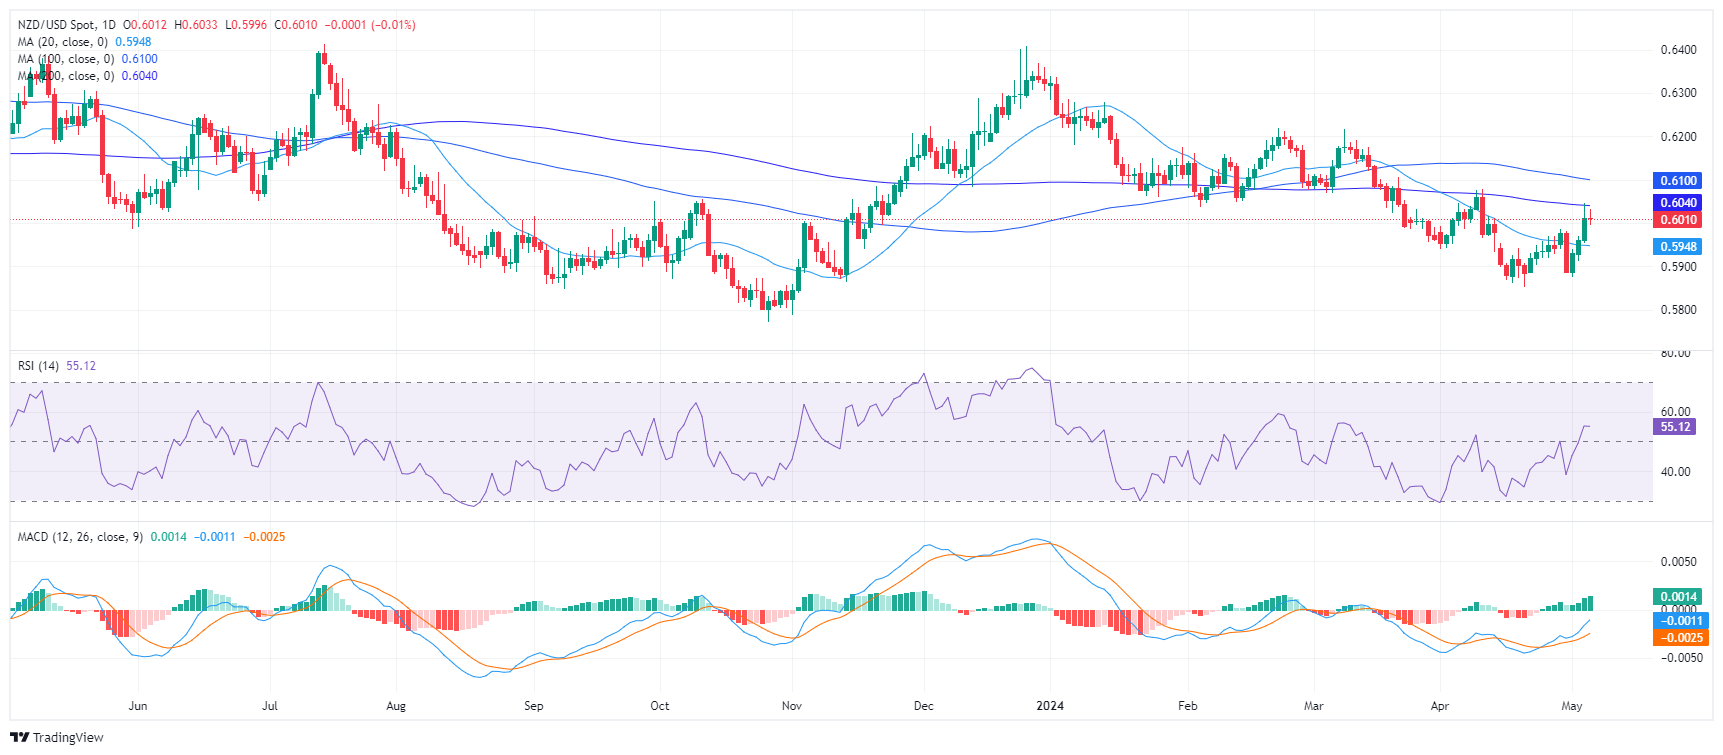
On the daily chart, the Relative Strength Index (RSI) points toward the positive territory, signaling that buyers are beginning to gain control. The gradual shift to 56 from a low of 38 indicates dominant bullish momentum. The Moving Average Convergence Divergence (MACD) further confirms this bullish sentiment with its rising green bars which denote positive momentum.
NZD/USD daily chart
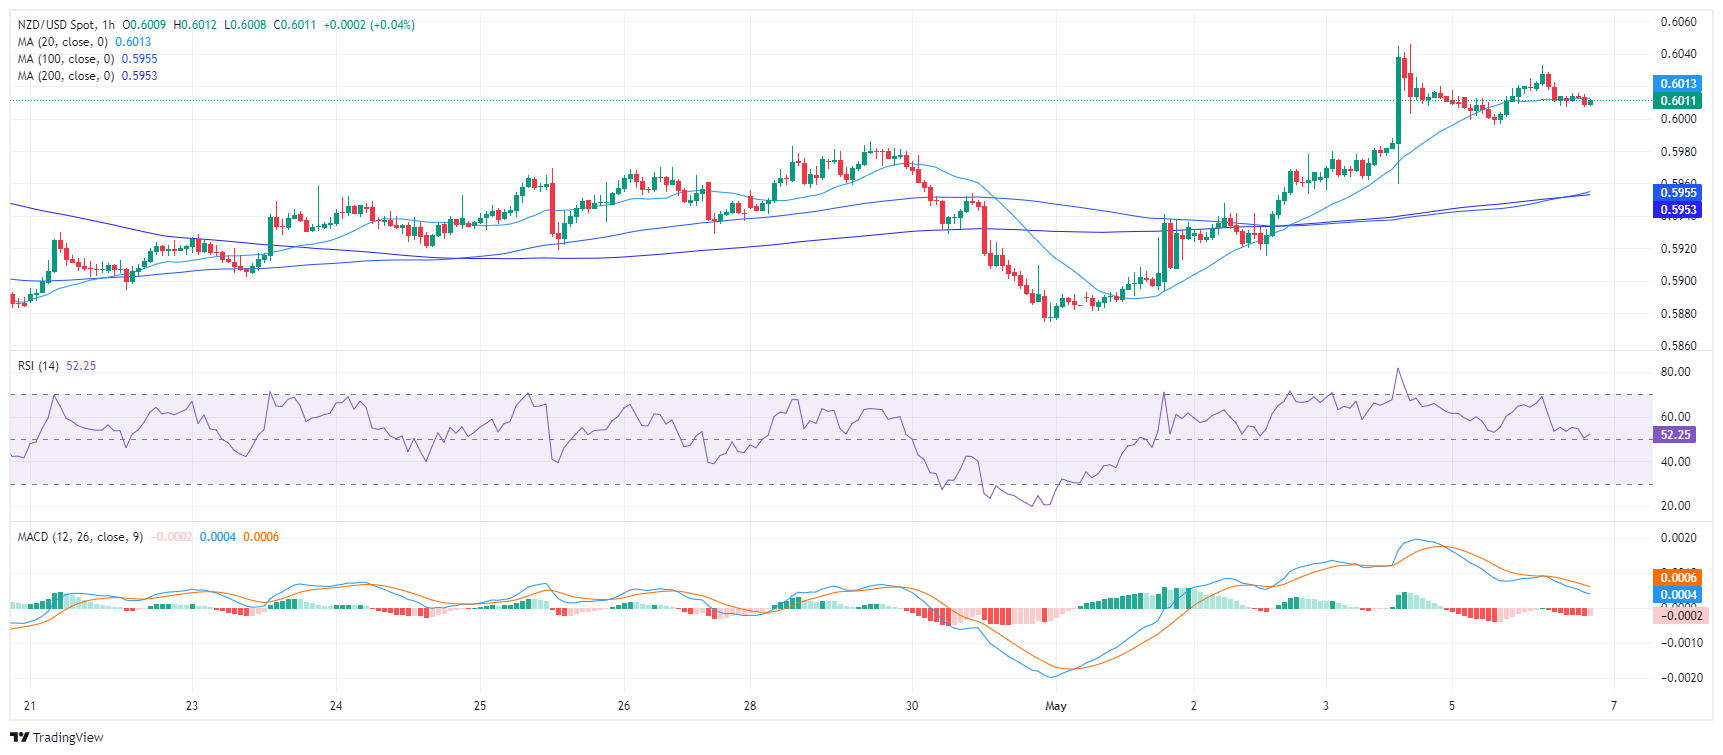
While assessing the hourly chart, the RSI depicts moderate fluctuations within the positive region. The most recent reading stands at 51, slightly below its daily counterpart, which could hint at a mild slowdown in buyer momentum. The view is affirmed by the MACD histogram that displays flat red bars, indicating a reduction in positive momentum.
NZD/USD hourly chart
When considering the broader outlook, the NZD/USD position concerning its Simple Moving Averages (SMA) reveals a short-term bullish outset against a potentially long-term bearish trajectory. However, a noted drawback in buyers at the 100-day SMA underscores a potential bearish trend that traders should closely monitor.
Forex News
Keep up with the financial markets, know what's happening and what is affecting the markets with our latest market updates. Analyze market movers, trends and build your trading strategies accordingly.