Japanese Yen holds gains ahead of US Manufacturing PMI
- The Japanese Yen pares its daily gains ahead of the US Manufacturing PMI release on Thursday.
- Japan’s Ministry of Finance reported that officials spent ¥5.53 trillion ($36.8 billion) in July to stabilize the Yen.
- The US Dollar depreciated after the Fed maintained rates at 5.25%-5.50% on Wednesday.
The Japanese Yen (JPY) offers its intraday gains as the US Dollar (USD) advances due to a recovery in Treasury yields on Thursday. However, The JPY approached its four-month high of 148.50 during the early Asian hours. This JPY's rise might be attributed to the unexpected hawkish policy announcements of the Bank of Japan (BoJ).
The Bank of Japan (BoJ) released the full version of its Quarterly Outlook Report on Thursday, noting that there is a possibility wages and inflation could exceed expectations. This could be accompanied by rising inflation expectations and a tight labor market.
The Bank of Japan increased the short-term rate target by 15 basis points (bps), raising it to a range of 0.15%-0.25% from the previous 0%-0.1%. Additionally, the bank outlined a plan to reduce its purchases of Japanese government bonds (JGBs) to ¥3 trillion per month, starting in the first quarter of 2026.
The USD/JPY pair faced challenges as the US Dollar struggled after the Federal Reserve (Fed) decided to maintain rates at 5.25%-5.50% during its July meeting on Wednesday. Traders will seek additional guidance from upcoming US economic data, including the ISM Manufacturing PMI and weekly Initial Jobless Claims, set to be released later on Thursday.
Daily Digest Market Movers: Japanese Yen extends rally after a surprise rate hike by BoJ
- Japan’s Chief Cabinet Secretary Yoshimasa Hayashi stated on Thursday that currencies must move steadily and reflect their underlying fundamentals. Hayashi refrained from commenting on specific forex levels but noted that he is closely monitoring foreign exchange movements, per Reuters.
- Federal Reserve Chair Jerome Powell stated during a press conference that a rate cut in September is "on the table." Powell added that the central bank will closely monitor the labor market and remain vigilant for signs of a potential sharp downturn, per Reuters.
- Reuters reported on Wednesday that Japan’s Ministry of Finance confirmed suspicions of market intervention by authorities. In July, Japanese officials spent ¥5.53 trillion ($36.8 billion) to stabilize the Yen, which had fallen to its lowest level in 38 years.
- BoJ Governor Kazuo Ueda deemed it appropriate to adjust the degree of easing to sustainably and stably achieve the 2% inflation target. Additionally, he emphasized that they will keep raising interest rates. Moreover, Japan's largest lender Mitsubishi UFJ Bank announced that it will raise its short-term prime lending rate to 1.625% from 1.475% starting from September 2, aligning with the BoJ’s rate hike, per Reuters.
- Assessing the BoJ's policy outlook moving forward, "the BoJ’s policy statement includes a fairly optimistic assessment of the Japanese economic outlook stating that fixed investment is ‘on a moderate increasing trend’ and corporate profits are ‘improving’," said Rabobank analysts and added: "It states that wage rises ‘have been spreading across regions, industries, and firm sizes.’ This leaves the door open for further rate hikes potentially in late 2024 or early 2025."
- Private sector employment in the US rose 122,000 in July and annual pay was up 4.8% year-over-year, the Automatic Data Processing (ADP) reported on Wednesday. This reading followed the 155,000 increase (revised from 150,000) recorded in June and came in below the market expectation of 150,000.
- Atsushi Mimura, Japan’s newly appointed Vice Finance Minister for International Affairs and top foreign exchange official stated in a Bloomberg interview on Monday that “while the recent depreciation of the Yen has both advantages and disadvantages, the demerits are becoming more noticeable.” Mimura mentioned that intervention is among the measures available to counter excessive speculation affecting the currency.
Technical Analysis: USD/JPY moves below 150.00
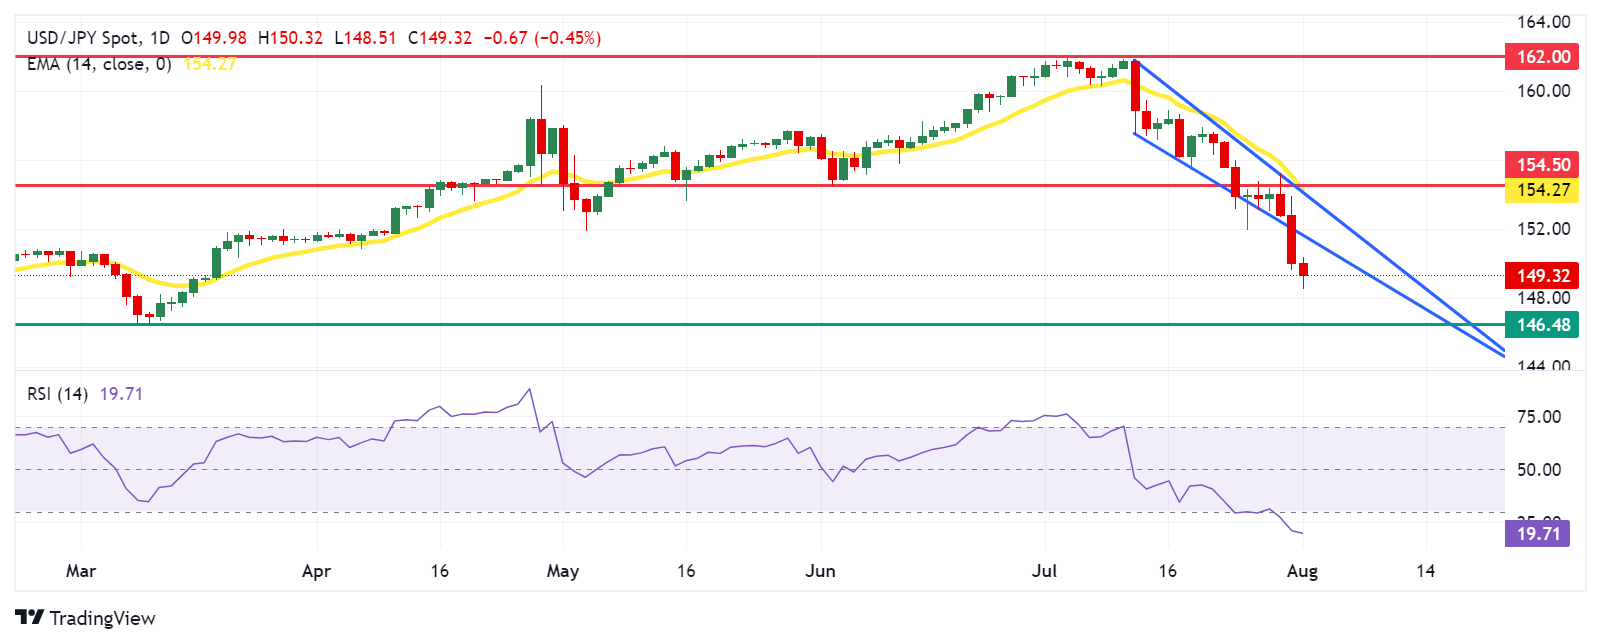
USD/JPY trades around 149.30 on Thursday. The daily chart analysis shows that the pair has broken below the descending wedge pattern, suggesting that the bearish trend is continuing rather than reversing. Additionally, the 14-day Relative Strength Index (RSI) is positioned below 30, suggesting an oversold currency asset situation and a potential short-term rebound.
The USD/JPY pair may test the support around a four-month low at the 146.48 level recorded in March.
On the upside, the USD/JPY pair might encounter resistance near the lower boundary of the descending wedge at 151.60. If the pair returns to this wedge, it could weaken the extended bearish trend and set the stage for a possible bullish reversal. The pair may then test the upper boundary of the wedge, which aligns with the 14-day Exponential Moving Average (EMA) at 154.27 and the "throwback support turned resistance" at 154.50.
USD/JPY: Daily Chart

Japanese Yen PRICE Today
The table below shows the percentage change of Japanese Yen (JPY) against listed major currencies today. Japanese Yen was the strongest against the British Pound.
| USD | EUR | GBP | JPY | CAD | AUD | NZD | CHF | |
|---|---|---|---|---|---|---|---|---|
| USD | 0.36% | 0.61% | -0.24% | 0.18% | 0.38% | 0.17% | -0.22% | |
| EUR | -0.36% | 0.25% | -0.61% | -0.19% | 0.02% | -0.18% | -0.58% | |
| GBP | -0.61% | -0.25% | -0.86% | -0.44% | -0.22% | -0.44% | -0.83% | |
| JPY | 0.24% | 0.61% | 0.86% | 0.42% | 0.63% | 0.37% | -0.01% | |
| CAD | -0.18% | 0.19% | 0.44% | -0.42% | 0.22% | 0.00% | -0.39% | |
| AUD | -0.38% | -0.02% | 0.22% | -0.63% | -0.22% | -0.21% | -0.60% | |
| NZD | -0.17% | 0.18% | 0.44% | -0.37% | -0.00% | 0.21% | -0.40% | |
| CHF | 0.22% | 0.58% | 0.83% | 0.01% | 0.39% | 0.60% | 0.40% |
The heat map shows percentage changes of major currencies against each other. The base currency is picked from the left column, while the quote currency is picked from the top row. For example, if you pick the Japanese Yen from the left column and move along the horizontal line to the US Dollar, the percentage change displayed in the box will represent JPY (base)/USD (quote).
Economic Indicator
ISM Manufacturing PMI
The Institute for Supply Management (ISM) Manufacturing Purchasing Managers Index (PMI), released on a monthly basis, is a leading indicator gauging business activity in the US manufacturing sector. The indicator is obtained from a survey of manufacturing supply executives based on information they have collected within their respective organizations. Survey responses reflect the change, if any, in the current month compared to the previous month. A reading above 50 indicates that the manufacturing economy is generally expanding, a bullish sign for the US Dollar (USD). A reading below 50 signals that factory activity is generally declining, which is seen as bearish for USD.
Read more.Next release: Thu Aug 01, 2024 14:00
Frequency: Monthly
Consensus: 48.8
Previous: 48.5
Source: Institute for Supply Management
The Institute for Supply Management’s (ISM) Manufacturing Purchasing Managers Index (PMI) provides a reliable outlook on the state of the US manufacturing sector. A reading above 50 suggests that the business activity expanded during the survey period and vice versa. PMIs are considered to be leading indicators and could signal a shift in the economic cycle. Stronger-than-expected prints usually have a positive impact on the USD. In addition to the headline PMI, the Employment Index and the Prices Paid Index numbers are watched closely as they shine a light on the labour market and inflation.
Forex News
Keep up with the financial markets, know what's happening and what is affecting the markets with our latest market updates. Analyze market movers, trends and build your trading strategies accordingly.
