GBP/USD Price Analysis: Pierces one-week-old resistance line in search of fresh 2023 high
- GBP/USD grinds higher after crossing one-week-long descending trend line, up for the second consecutive day.
- Looming bull cross on MACD, sustained trading above short-term key support line, 100-SMA favor Cable buyers.
- Bears need validation from 1.2180 to retake control.
GBP/USD prints mild gains around 1.2430 as traders await the week’s key catalysts headlines into Wednesday’s London open.
Also read: GBP/USD stays defensive above 1.2400, focus on US inflation, BoE’s Bailey and Fed Minutes
In doing so, the Cable pair struggles to cheer the recent upside break of the one-week-old descending trend line, now immediate support around 1.2415.
However, an impending bull cross on the MACD indicator joins the GBP/USD pair’s successful trading above 100-SMA and an upward-sloping trend line from March 24 keeps the buyers hopeful.
As a result, the bulls can ignore the latest inaction while keeping their eyes on the Year-To-Date (YTD) high of 1.2525, marked earlier in April.
Following that, the 1.2600 round figure and the May 2022 peak of around 1.2665 will be in focus.
Meanwhile, GBP/USD may witness intraday selling on a clear downside break of the nearby resistance-turned-support line of around 1.2415.
In that case, the three-week-old support line and the 100-SMA, respectively near 1.2370 and 1.2355, will be in focus.
It’s worth noting, however, that the GBP/USD bears should remain cautious until witnessing a daily closing below the one-month-long horizontal support zone surrounding 1.2200-2180.
Overall, GBP/USD remains on the bull’s radar even if the pre-data anxiety prods upside momentum of late.
GBP/USD: Four-hour chart
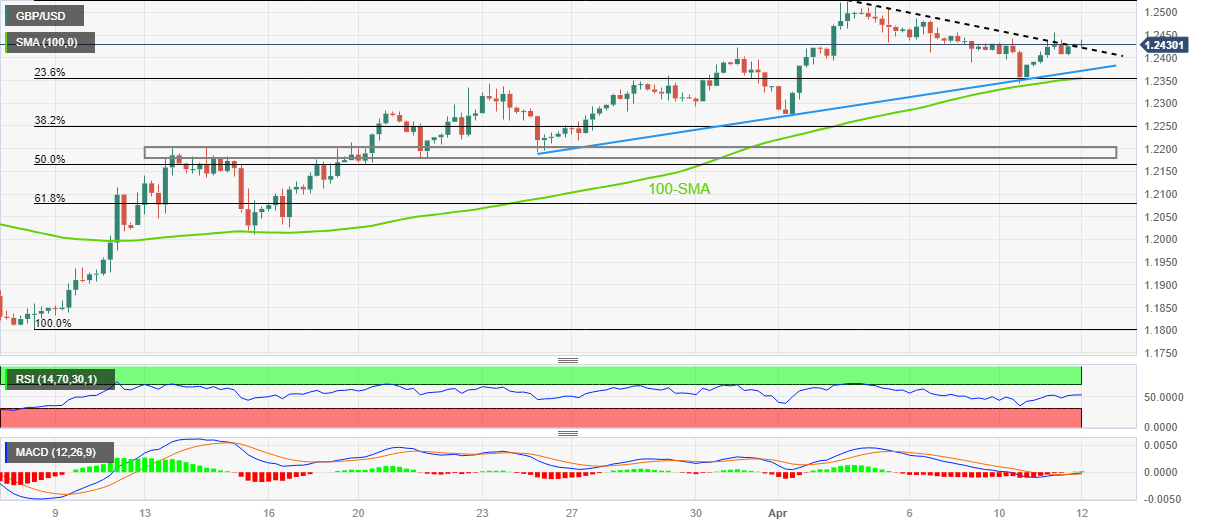
Trend: Further upside expected
Forex News
Keep up with the financial markets, know what's happening and what is affecting the markets with our latest market updates. Analyze market movers, trends and build your trading strategies accordingly.