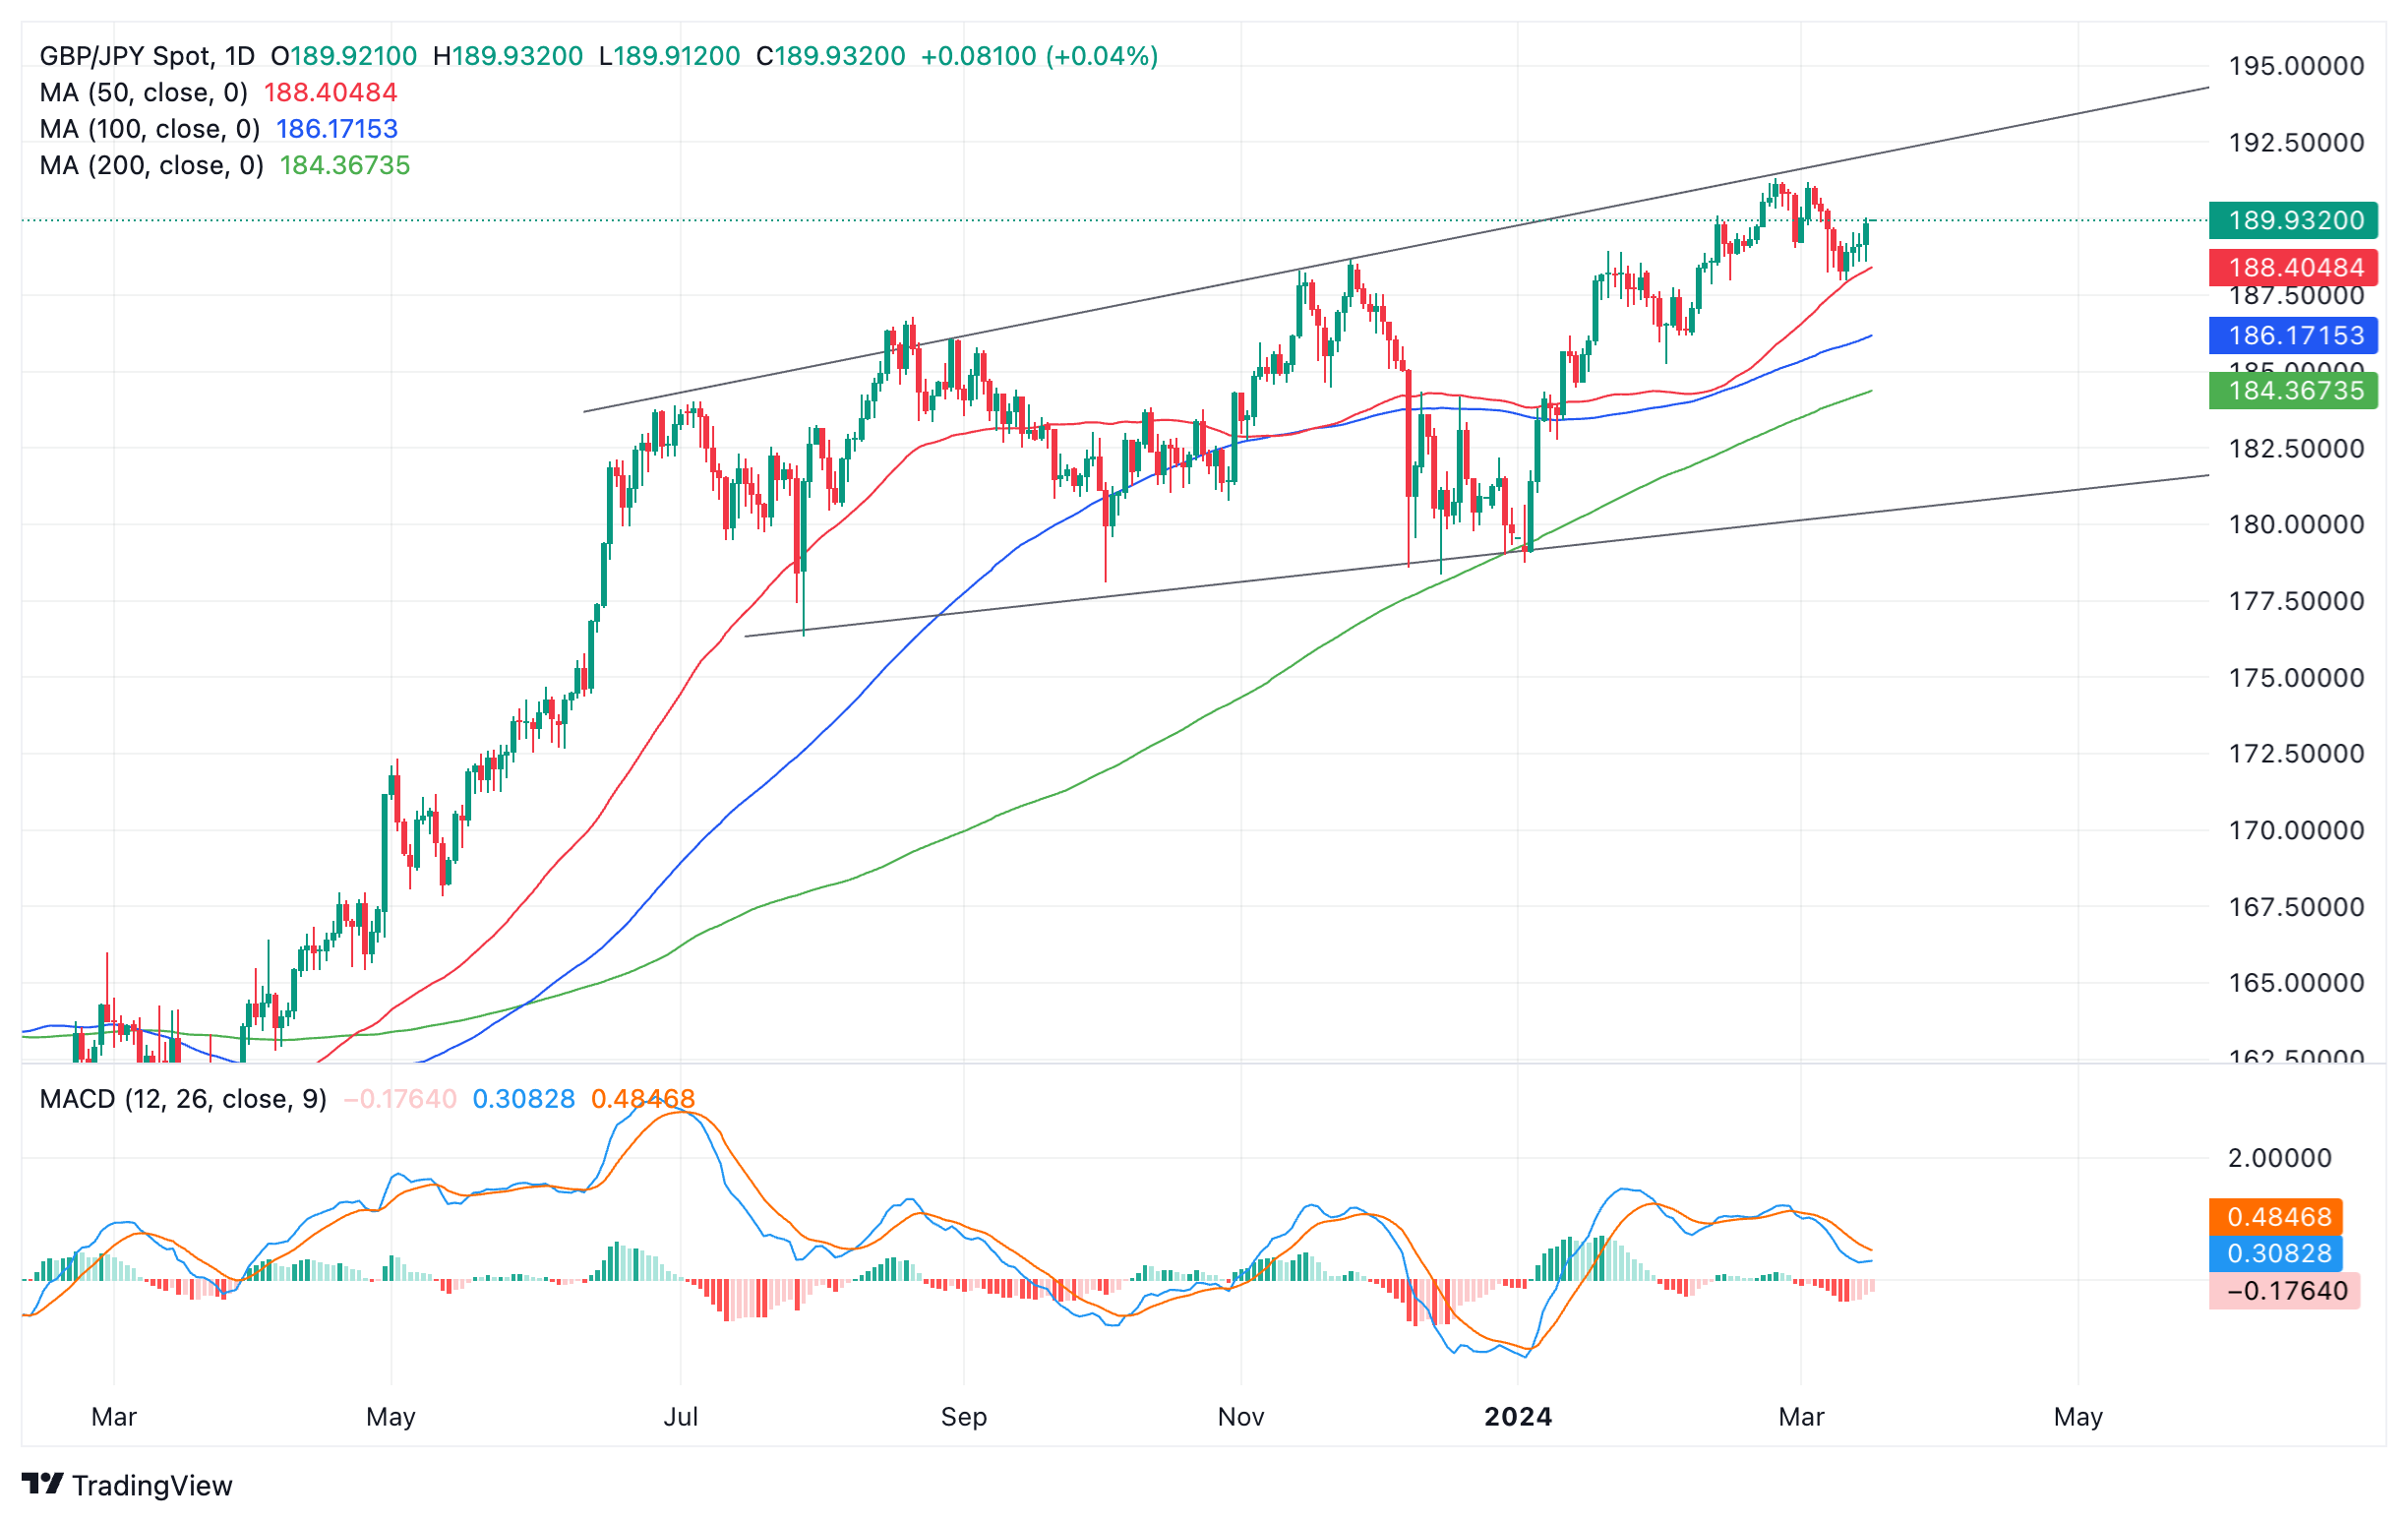
GBP/JPY Price Analysis: Pulling back within Broadening formation
- GBP/JPY has likely formed a Broadening topping pattern.
- It has just reversed after touching the top of the pattern and looks poised for a down-leg.
- The overall long-term trend, however, is bullish with a breakout from the pattern required to reverse.
GBP/JPY appears to be forming a bearish Ascending Broadening Wedge formation. The pair has just rallied to the pattern’s upper boundary line before forming a double top and pulling back. There is now a good chance it has begun the next down-leg of the pattern.
A decisive break below support at the 187.96 March 11 lows and the nearby 50-day Simple Moving Average (SMA) would confirm a continuation of the next down leg within the wedge.

Pound Sterling versus Japanese Yen: Daily chart
Such a move would probably see GBP/JPY fall to support near the 50-week Simple Moving Average (SMA) at 181.60.
It is worth noting that although a deep correction looks on the cards, over the long-term, the peaks and troughs of price are rising. This likely indicates GBP/JPY is in an overall uptrend, which is likely to continue as long as price does not break completely out of the bottom of the wedge at around 180.80-90. A downside breakout, however, would confirm a reversal of the long-term uptrend.
A break above the 191.32 highs would provide confirmation the dominant bull trend was intact and continuing higher. Although it looks overstretched, such a move is still possible given the overall bullishness of the chart. The next upside target from there would probably be resistance at the 195.88 highs of 2015.
Forex News
Keep up with the financial markets, know what's happening and what is affecting the markets with our latest market updates. Analyze market movers, trends and build your trading strategies accordingly.
