
Australian Dollar advances as inflation gauge rises in April, US ISM Services PMI eyed
- The Australian Dollar strengthened after Prime Minister Anthony Albanese secured a second three-year term in the 2025 Federal Election.
- Australia’s Judo Bank Composite PMI came in at 51.0 for April, marking the seventh consecutive month of expansion.
- President Trump confirmed he does not intend to replace Fed Chair Powell before his term concludes in May 2026.
The Australian Dollar (AUD) is extending its gains against the US Dollar (USD) for a second consecutive session on Monday. The AUD/USD pair is rising after Australian Prime Minister Anthony Albanese secured a second three-year term in the 2025 Federal Election, achieving significant gains in Saturday’s results.
Labor Party leader Albanese has claimed a majority in parliament, with over 45% of the votes counted. Albanese promised a “disciplined” government prioritizing cost-of-living relief, navigating global trade tensions, and reaffirming support for renewable energy, tax cuts, housing, and healthcare spending. However, these measures may add to inflationary pressures, potentially constraining the Reserve Bank of Australia’s (RBA) scope to lower interest rates.
Economic data also supported the AUD, with the TD-MI Inflation Gauge rising 0.6% MoM in April, easing from March’s 0.7% but marking a second consecutive month increase. Meanwhile, the annual Inflation Gauge rose 3.3%, against the previous 2.8% increase.
Australia’s Judo Bank Composite Purchasing Managers Index (PMI) posted a reading of 51.0 in April. This indicates continued expansion for a seventh straight month, although the pace slowed from 51.6 in March. The Services PMI also came in at 51.0, marking fifteen consecutive months of growth.
In external developments, China’s Commerce Ministry announced Friday that Beijing is considering a US offer to resume trade talks. This follows recent comments by US President Donald Trump, who claimed negotiations were already in progress. However, Trump added that he has no plans to speak with Chinese President Xi Jinping this week. Any signs of rising tensions between the US and China could negatively impact the AUD, given Australia’s strong trade ties with China.
Meanwhile, US companies planning to shift production from China to domestic facilities may need to reassess, following Trump's latest comments on tariffs. Speaking over the weekend, Trump acknowledged the potential impact of high tariffs: “At some point, I’m going to lower them, because otherwise, you could never do business with them, and they want to do business very much.”
Australian Dollar appreciates as US Dollar struggles ahead of ISM Services PMI
- The US Dollar Index (DXY), which tracks the USD against a basket of six major currencies, is losing ground for the second successive day, trading near 99.80 at the time of writing. Later in the day, traders will watch for the US ISM Services PMI for further direction.
- President Trump has confirmed that he will not seek to replace Federal Reserve Chair Jerome Powell before his term ends in May 2026. Although Trump criticized Powell, calling him “a total stiff,” he maintained that interest rates should eventually be lowered.
- In other policy moves, Trump announced plans to instruct the US Trade Representative and the Commerce Department to initiate the process of imposing a 100% tariff on foreign-produced films.
- The US Nonfarm Payrolls (NFP) report for April showed a stronger-than-expected increase of 177,000 jobs, following a revised gain of 185,000 in March. This exceeded the market forecast of 130,000. The unemployment rate remained unchanged at 4.2%, while average hourly earnings rose 3.8% year-over-year, matching the previous month’s figure.
- US Treasury Secretary Janet Yellen cautioned that Trump’s tariffs could have a "tremendously adverse" impact on the US economy. Treasury Secretary Scott Bessent noted that the inverted yield curve, with two-year yields below the federal funds rate, supports the case for Federal Reserve rate cuts.
- The Australian Bureau of Statistics reported on Thursday a trade surplus of AUD 6.9 billion for March, significantly surpassing expectations of AUD 3.13 billion and the revised February figure of AUD 2.85 billion (down from AUD 2.97 billion). The strong surplus was driven by a 7.6% rise in exports and a 2.2% decline in imports for the month.
- Australia’s Retail Sales on Friday—a key indicator of consumer spending—increased by 0.3% month-over-month in March, up from a 0.8% rise in February (revised from 0.2%), according to data released Friday by the Australian Bureau of Statistics (ABS). However, the figure fell short of market expectations, which had forecast a 0.4% gain.
- Australian Treasurer Jim Chalmers noted that markets still anticipate further interest rate cuts. “The market expects more interest rate cuts after inflation figures,” he stated, adding that there’s “nothing in these numbers that would substantially alter market expectations.”
- Inflationary pressures in Australia in early 2025 have weakened expectations of further monetary easing by the Reserve Bank of Australia (RBA). However, markets anticipate a 25-basis-point rate cut in May, as policymakers prepare for possible economic fallout from the recently introduced US tariffs.
- According to Bloomberg, China is considering renewed trade talks with the US. The Chinese Commerce Ministry noted that Washington has reached out to express interest in resuming negotiations. However, China is reportedly conducting an internal assessment and maintains that the US should correct its tariff-related actions, which it views as the unilateral trigger for the ongoing trade dispute.
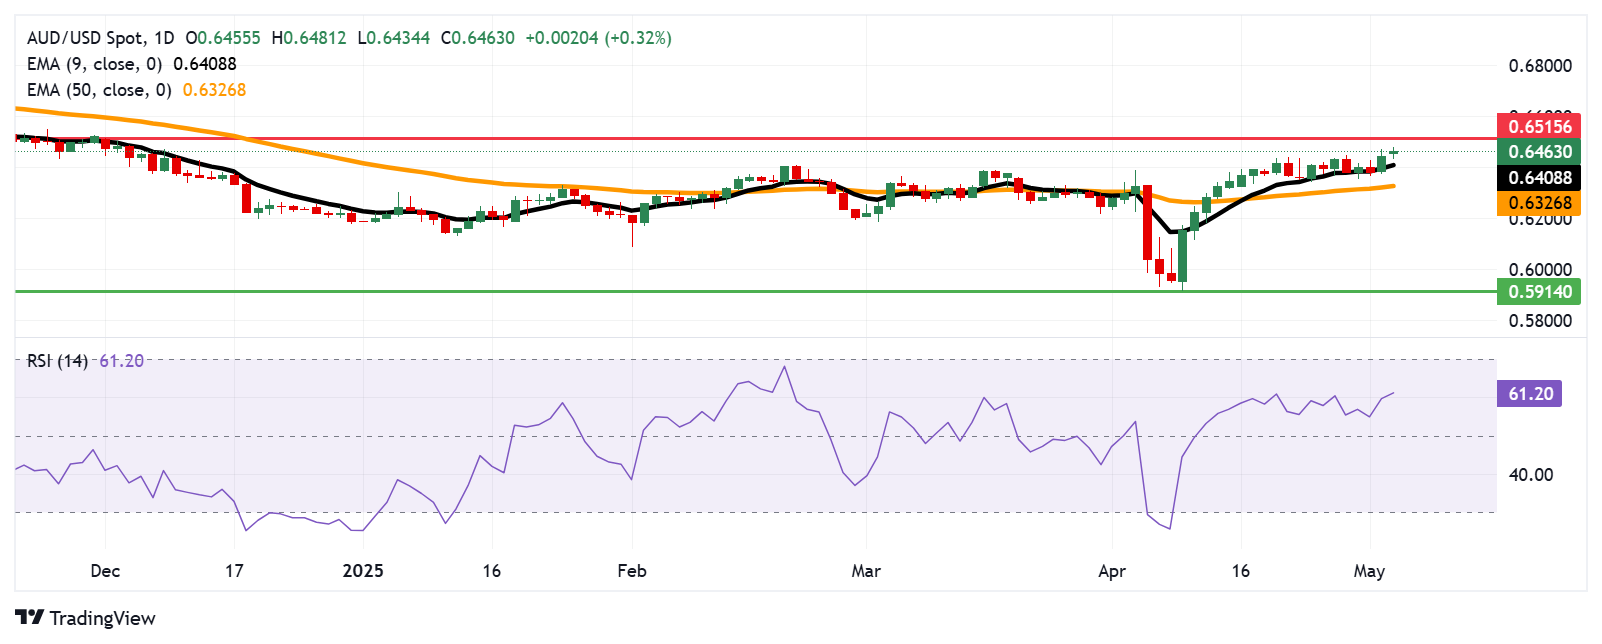
Australian Dollar rises toward 0.6500 near five-month highs
The AUD/USD pair is trading around 0.6460 on Monday, maintaining a bullish bias on the daily chart. The pair continues to hold above the nine-day Exponential Moving Average (EMA), while the 14-day Relative Strength Index (RSI) remains comfortably above 50, both suggesting sustained upward momentum.
On the upside, the AUD/USD pair could approach the five-month high at 0.6515, followed by the psychological level of 0.6600.
The AUD/USD pair may find initial support at the nine-day EMA at 0.6408, followed by the 50-day EMA at 0.6326. A breach below these levels could weaken the bullish outlook and may expose the pair to 0.5914, the lowest since March 2020.
AUD/USD: Daily Chart
(This story was corrected on May 05 at 02:50 GMT to say, in the first line of technical analysis, that the AUD/USD pair is trading around 0.6460 on Monday, not on Thursday.)
Australian Dollar PRICE Today
The table below shows the percentage change of Australian Dollar (AUD) against listed major currencies today. Australian Dollar was the strongest against the Canadian Dollar.
| USD | EUR | GBP | JPY | CAD | AUD | NZD | CHF | |
|---|---|---|---|---|---|---|---|---|
| USD | -0.03% | -0.26% | -0.40% | -0.02% | -0.25% | -0.50% | -0.31% | |
| EUR | 0.03% | 0.05% | -0.10% | 0.28% | 0.05% | -0.20% | -0.01% | |
| GBP | 0.26% | -0.05% | -0.36% | 0.24% | 0.00% | -0.25% | -0.06% | |
| JPY | 0.40% | 0.10% | 0.36% | 0.38% | 0.16% | -0.02% | 0.19% | |
| CAD | 0.02% | -0.28% | -0.24% | -0.38% | -0.53% | -0.48% | -0.30% | |
| AUD | 0.25% | -0.05% | -0.01% | -0.16% | 0.53% | -0.25% | -0.06% | |
| NZD | 0.50% | 0.20% | 0.25% | 0.02% | 0.48% | 0.25% | 0.18% | |
| CHF | 0.31% | 0.01% | 0.06% | -0.19% | 0.30% | 0.06% | -0.18% |
The heat map shows percentage changes of major currencies against each other. The base currency is picked from the left column, while the quote currency is picked from the top row. For example, if you pick the Australian Dollar from the left column and move along the horizontal line to the US Dollar, the percentage change displayed in the box will represent AUD (base)/USD (quote).
Economic Indicator
ISM Services PMI
The Institute for Supply Management (ISM) Services Purchasing Managers Index (PMI), released on a monthly basis, is a leading indicator gauging business activity in the US services sector, which makes up most of the economy. The indicator is obtained from a survey of supply executives across the US based on information they have collected within their respective organizations. Survey responses reflect the change, if any, in the current month compared to the previous month. A reading above 50 indicates that the services economy is generally expanding, a bullish sign for the US Dollar (USD). A reading below 50 signals that services sector activity is generally declining, which is seen as bearish for USD.
Read more.Next release: Mon May 05, 2025 14:00
Frequency: Monthly
Consensus: 50.6
Previous: 50.8
Source: Institute for Supply Management
The Institute for Supply Management’s (ISM) Services Purchasing Managers Index (PMI) reveals the current conditions in the US service sector, which has historically been a large GDP contributor. A print above 50 shows expansion in the service sector’s economic activity. Stronger-than-expected readings usually help the USD gather strength against its rivals. In addition to the headline PMI, the Employment Index and the Prices Paid Index numbers are also watched closely by investors as they provide useful insights regarding the state of the labour market and inflation.
Forex News
Keep up with the financial markets, know what's happening and what is affecting the markets with our latest market updates. Analyze market movers, trends and build your trading strategies accordingly.